


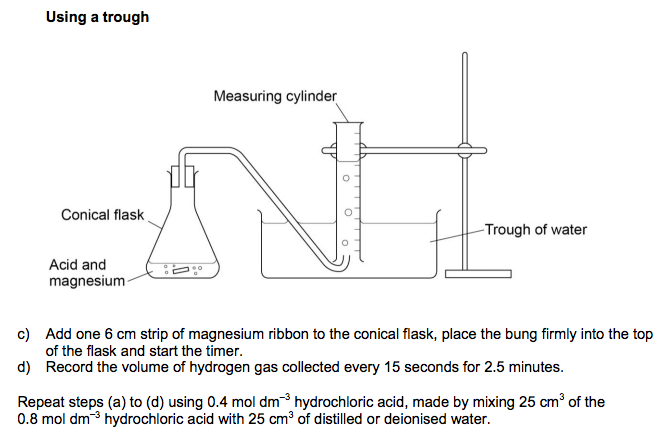
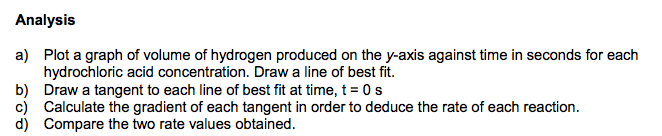

Continuous Monitoring When we follow one experiment over time recording the change in concentration we call it a continuous rate method. The gradient represents the rate of reaction. The reaction is fastest at the start where the gradient is steepest. The rate drops as the reactants start to get used up and their concentration drops. The graph will eventual become horizontal and the gradient becomes zero which represents the reaction having stopped. time concentration Measurement of the change in volume of a gas Mg + HCl MgCl2 +H2 This works if there is a change in the number of moles of gas in the reaction. Using a gas syringe is a common way of following this. It works quite well for measuring continuous rate but a typical gas syringe only measures 100ml of gas so you don’t want at reaction to produce more than this volume. Quantities of reactants need to be calculated carefully. gas syringe Typical Method • Measure 50 cm3 of the 1.0 mol dm–3 hydrochloric acid and add to conical flask. • Set up the gas syringe in the stand • Weigh 0.20 g of magnesium. • Add the magnesium ribbon to the conical flask, place the bung firmly into the top of the flask and start the timer. • Record the volume of hydrogen gas collected every 15 seconds for 3 minutes. The initial rate is the rate at the start of the reaction, where it is fastest. It is obtained by taking the gradient of a continuous monitoring conc vs time graph at time = zero. A measure of initial rate is preferable as we know the concentrations at the start of the reaction Large Excess of reactants In reactions where there are several reactants, if the concentration of one of the reactant is kept in a large excess then that reactant will appear not to affect rate and will be pseudo-zero order . This is because its concentration stays virtually constant and does not affect rate.A-level Chemistry exemplar for required practical No. 7 – part b Measuring the rate of reaction by a continuous monitoring method: The reaction between magnesium and hydrochloric acid Student sheet Requirements You are provided with the following: magnesium ribbon 0.8 mol dm–3 hydrochloric acid 50 cm3 measuring cylinder 100 cm3 conical flask rubber bung and delivery tube to fit conical flask 100 cm3 gas syringe OR trough/plastic container with 100 cm3 measuring cylinder stand, boss and clamp stopwatch or timer distilled or deionised water. Suggested method a) Measure 50 cm3 of the 0.8 mol dm–3 hydrochloric acid and add to conical flask. b) Set up the gas syringe in the stand (or alternative gas collection method as shown by your teacher). Using a gas syringe. Using a trough c) Add one 6 cm strip of magnesium ribbon to the conical flask, place the bung firmly into the top of the flask and start the timer. d) Record the volume of hydrogen gas collected every 15 seconds for 2.5 minutes. Repeat steps (a) to (d) using 0.4 mol dm–3 hydrochloric acid, made by mixing 25 cm3 of the 0.8 mol dm–3 hydrochloric acid with 25 cm3 of distilled or deionised water. Analysis a) Plot a graph of volume of hydrogen produced on the y-axis against time in seconds for each hydrochloric acid concentration. Draw a line of best fit. b) Draw a tangent to each line of best fit at time, t = 0 s c) Calculate the gradient of each tangent in order to deduce the rate of each reaction. d) Compare the two rate values obtained. Sample results The following table is a sample results table using results from the trial of this experiment. Volume of gas collected / cm3 Time / s 0.4 mol dm–3 hydrochloric acid 0.8 mol dm–3 hydrochloric acid 0 0.0 0.0 15 4.0 15.0 30 6.0 29.0 45 9.0 43.0 60 17.0 54.0 75 20.0 66.0 90 22.0 75.0 105 24.0 84.0 120 27.0 91.0 135 30.0 95.0 150 32.0 96.0 These were obtained using 0.8 mol dm–3 hydrochloric acid and 0.4 mol dm–3 hydrochloric acid with 6 cm strips of magnesium ribbon.
/
~
~
~
/
3.1.9.2 Determination of rate equation (A-level only)
Required practical 7
Measuring the rate of reaction:
• by a continuous monitoring method.
 1.9 Rate Equations Page 2 - 3
 Practical Guide Page : 135 - 137
 Oxford Textbook Pages : 278 - 280, 518
 CGP Revision Guide Pages : 68


