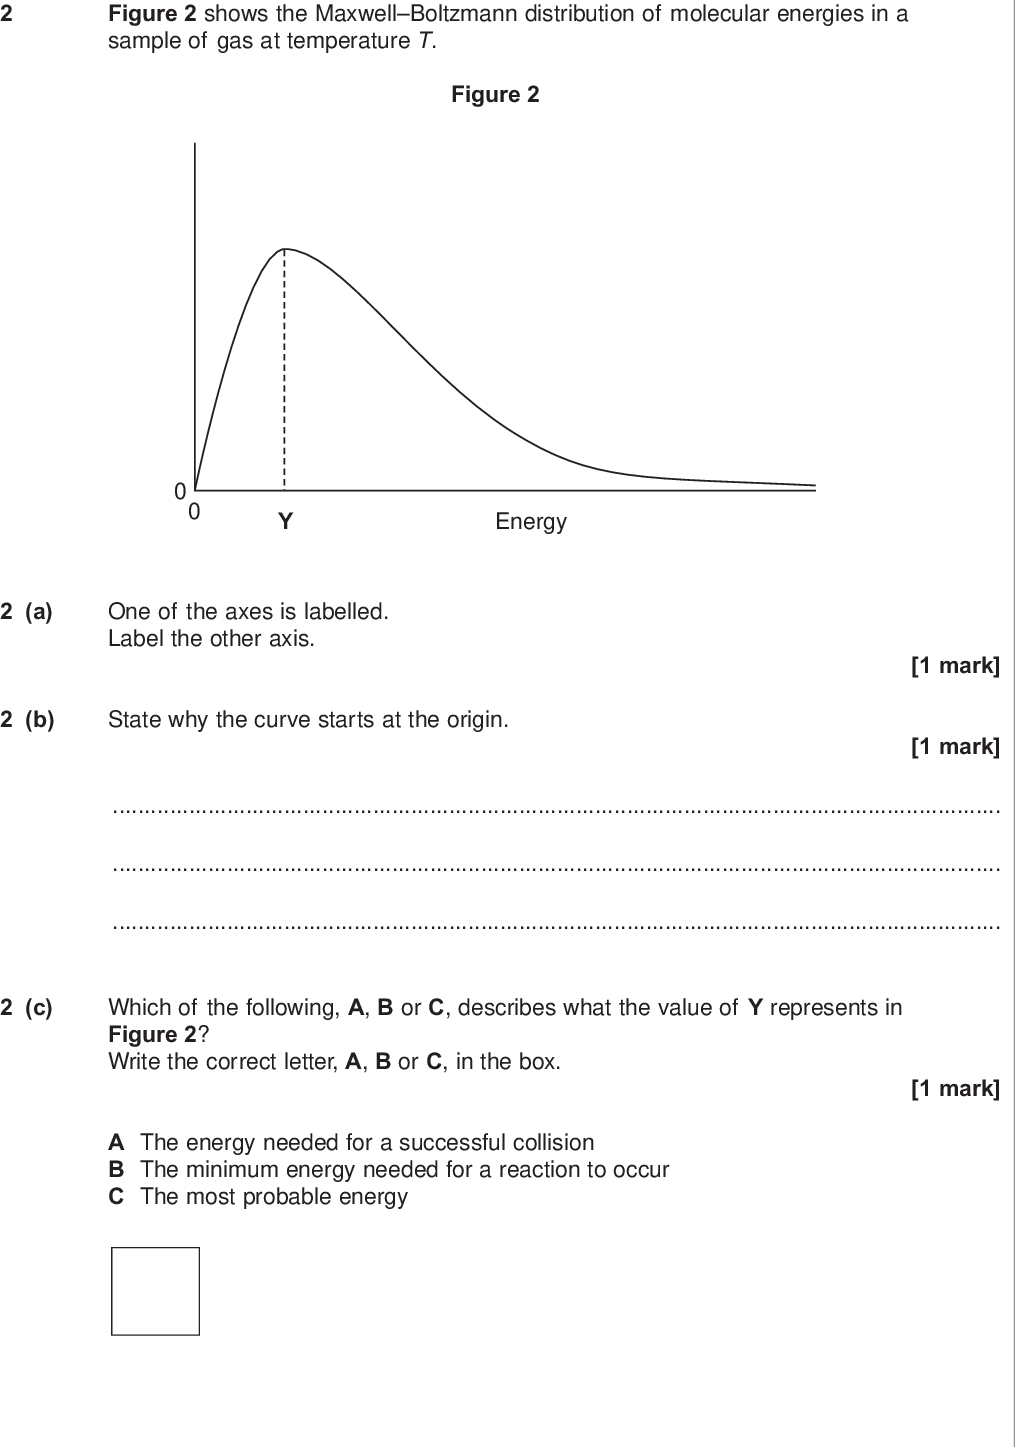
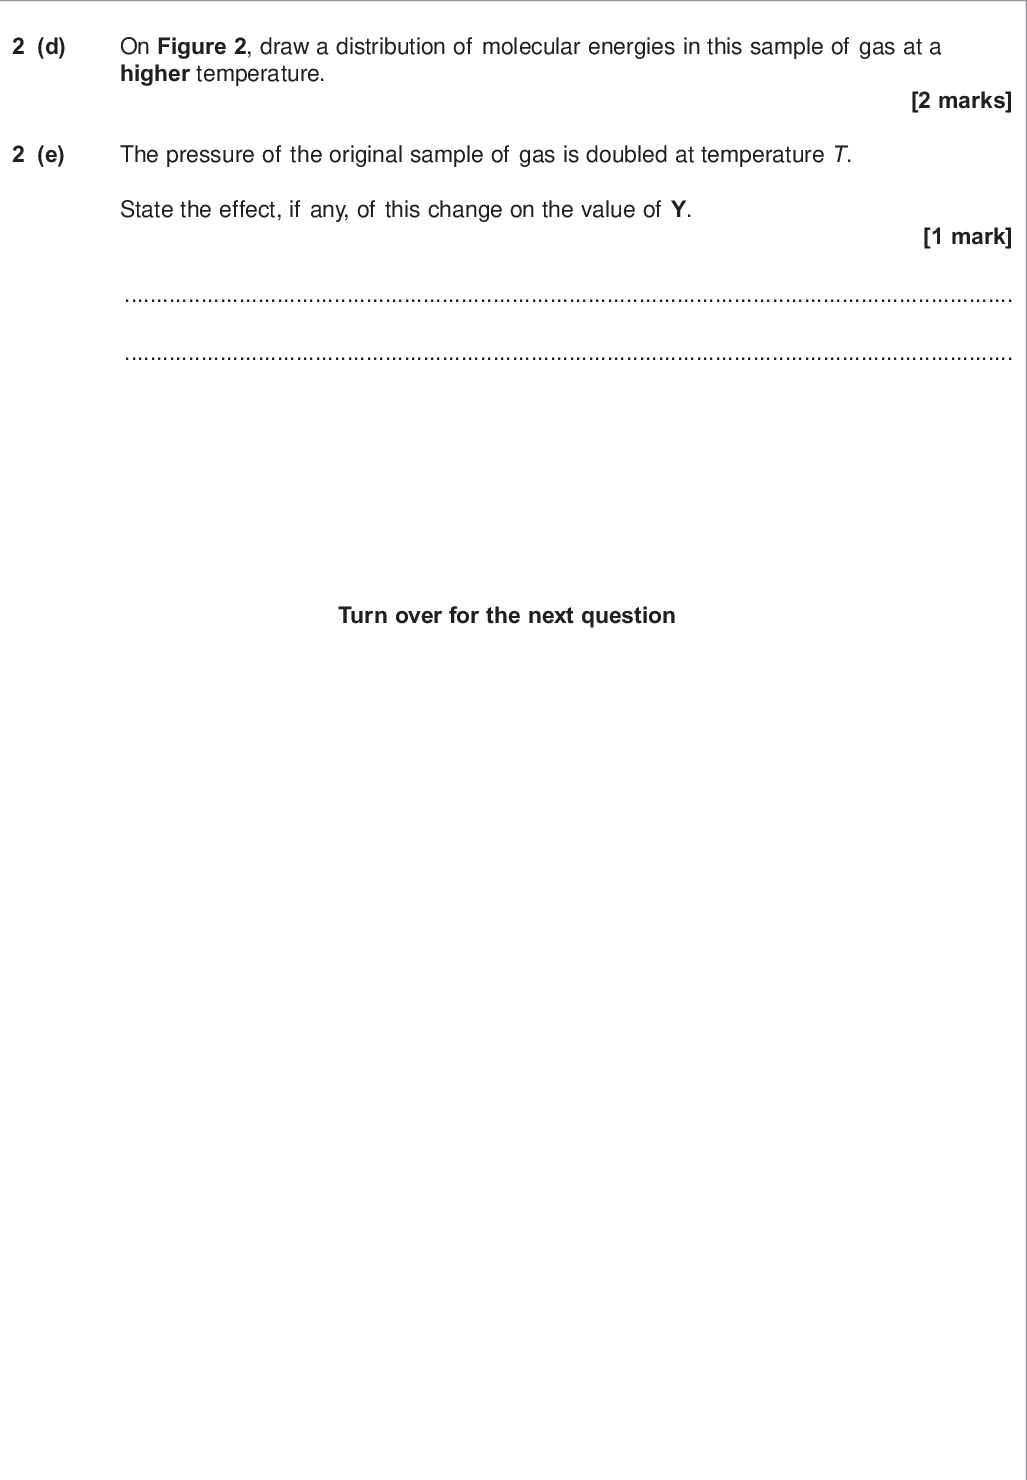
Maxwell Boltzmann Distribution The Maxwell-Boltzmann energy distribution shows the spread of energies that molecules of a gas or liquid have at a particular temperature Learn this curve carefully The energy distribution should go through the origin because there are no molecules with no energy The energy distribution should never meet the x axis, as there is no maximum energy for molecules The mean energy of the particles is not at the peak of the curve The area under the curve represents the total number of A few have low particles present energies because collisions cause some particles to slow down Only a few particles have energy greater than the EA Most molecules have energies between the two extremes but the distribution is not symmetrical (normal) Q. How can a reaction go to completion if few particles have energy greater than Ea? A. Particles can gain energy through collisions Increasing Temperature As the temperature increases the distribution shifts towards having more molecules with higher energies The total area under the curve should remain constant because the total number of particles is constant At higher temperatures the molecules have a wider range of energies than at lower temperatures. At higher temps both the Emp and mean energy shift to high energy values although the number of molecules with those energies decrease Ea Collision energy Fraction of molecules with energy higher temperature Lower temperature Ea Collision energy Fraction of molecules with energy mean Collision energy T= 25OC T= 1067OC F.Effect of Increasing Surface area Increasing surface area will cause collisions to occur more frequently between the reactant particles and this increases the rate of the reaction. If the activation energy is lower, more particles will have energy > EA, so there will be a higher frequency of effective collisions. The reaction will be faster Effect of Increasing Temperature At higher temperatures the energy of the particles increases. They collide more frequently and more often with energy greater than the activation energy. More collisions result in a reaction As the temperature increases, the graph shows that a significantly bigger proportion of particles have energy greater than the activation energy, so the frequency of successful collisions increases higher temperature Lower temperature Ea Collision energy Fraction of molecules with energy Ea catalysed Fraction of molecules with energy Collision energy Ea un catalysed With a lower activation energy more particles have energy greater than the activation energy
/
~
~
~
/
3.2.2 Reaction rates

The Boltzmann distribution (f) qualitative explanation of the Boltzmann distribution and its relationship with activation energy (see also 3.2.1 c) M3.1 (g) explanation, using Boltzmann distributions, of the qualitative effect on the proportion of molecules exceeding the activation energy and hence the reaction rate, for: (i) temperature changes (ii) catalytic behaviour (see also 3.2.2 c). M3.1 HSW1,2,5 Use of Boltzmann distribution model to explain effect on reaction rates.
 3.2.2 reaction rates Page 4 - 5
 Oxford Textbook Pages : 152 - 153
 CGP Revision Guide Pages : 74 - 75