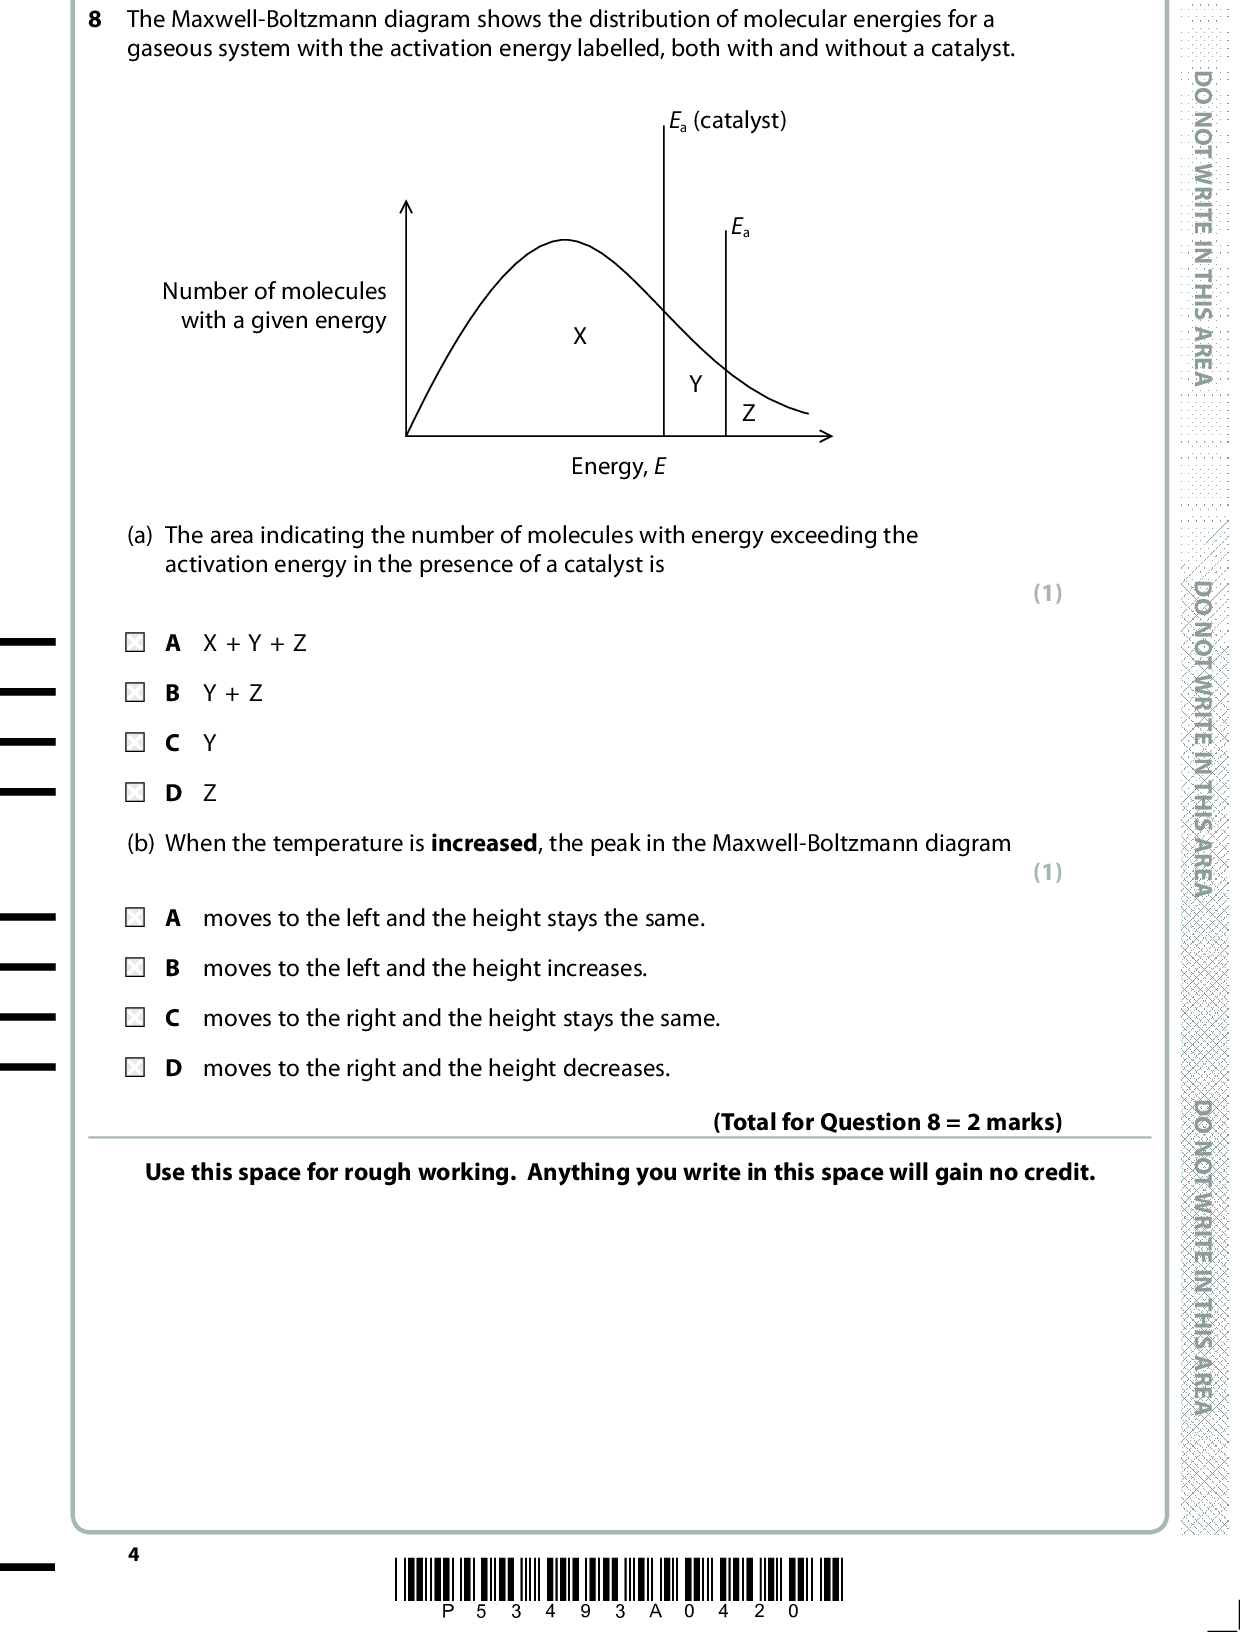
Edexcel Jun 2017 Paper 2 Q8

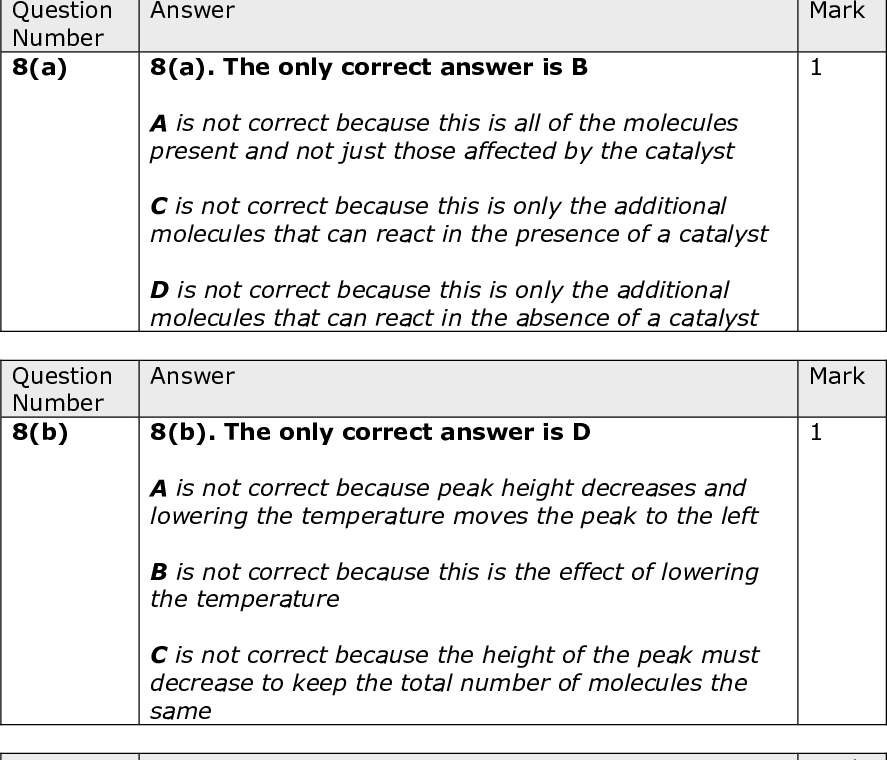
Answers available below

8 The Maxwell-Boltzmann diagram shows the distribution of molecular energies for a gaseous system with the activation energy labelled, both with and without a catalyst. Number of molecules with a given energy Ea (catalyst) Ea Energy, E (a) The area indicating the number of molecules with energy exceeding the activation energy in the presence of a catalyst is A X + Y + Z B Y + Z C Y D Z (b) When the temperature is increased, the peak in the Maxwell-Boltzmann diagram (1) (1) A moves to the left and the height stays the same. B moves to the left and the height increases. C moves to the right and the height stays the same. D moves to the right and the height decreases. Use this space for rough working. Anything you write in this space will gain no credit. (Total for Question 8 = 2 marks) *P53493A0420* D O N O T W R I T E I N T H I S A R E A D O N O T W R I T E I N T H I S A R E A D O N O T W R I T E I N T H I S A R E A<br />

Show answer