Skip to content
Edexcel Jan 2017 (IAL) Paper 4 Q3
Answers available below
Show answer
Question
1
2
3
4
5
6
7
8
9
10
11
12
13
14
15
16
17
18
19
20
21
22
23
24

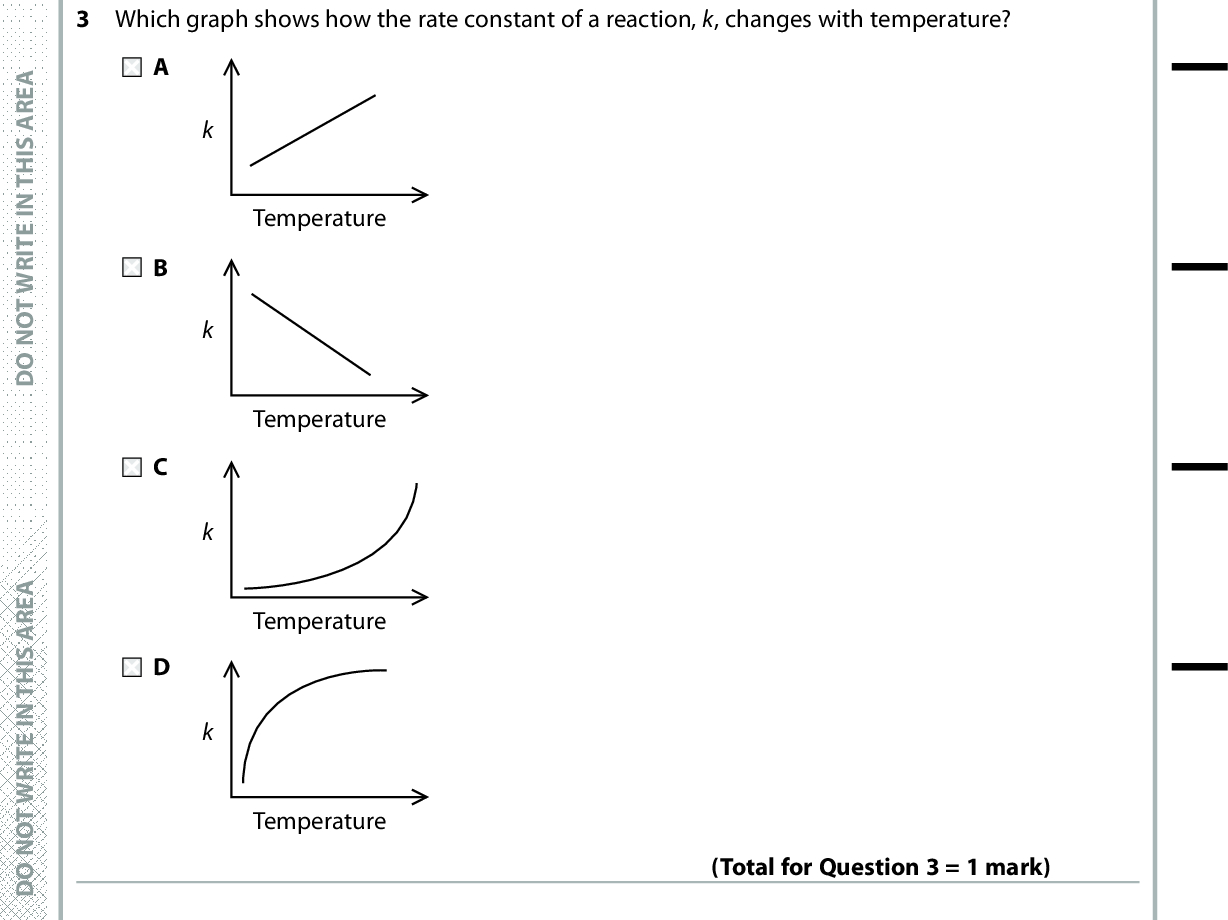
![Mark Mark Mark Mark Mark Unit should be (mol dm-3 s-1) divided by (mol dm-3) Correct Unit is not (mol dm-3 s-1) divided by (mol dm-3) Unit is not (mol dm-3s-1) divided by (mol dm-3) Rate decreases by factor of 4 when [NO] is halved and increases by factor of 2 when [Br2] is doubled so overall decreases by factor of 2/ is halved Rate is not doubled B C Correct D Rate is not quartered Correct Answer A B C D k is not directly proportional to temperature k does not decrease as temperature increases Correct k increases exponentially, not as shown Correct Answer A B C D Correct Answer A C D The temperature drops so it is true that H is positive Correct A gas is formed so it is true that Ssystem is positive The reaction is spontaneous so it is true that Stotal is positive The entropy of the system increases when more gas molecules form The entropy of the system increases when a gas forms from a solid Correct The entropy of the system increases when solid turns to liquid Section A (multiple choice) Question Number 1 Correct Answer A B C D Correct Answer A Question Number 2 Question Number 3 Question Number 4 Question Number 5<br />](https://learnah.org/wp-content/uploads/2018/08/January_2017_IAL_MS_-_Unit_4_Edexcel_Chemistry_A-level_3.jpg)