Skip to content
CIE Jun 2016 v3 Paper 5 Q2
Answers available below
Show answer
Question
1
2

![Activation energy, EA, is the minimum energy with which particles must collide so that a reaction occurs. The activation energy for the reaction of magnesium with aqueous hydrogen ions can be determined in the laboratory. Mg(s) + 2H+(aq)Mg2+(aq) + H2(g) PMT A magnesium strip is placed in dilute hydrochloric acid and the time taken (t), in seconds, for the magnesium to disappear is measured. The initial rate of reaction is calculated as time If the experiment is repeated at several different temperatures then the following mathematical relationship can be used to calculate EA. log10 1 1 1 t` j.1 T` t` j = 0.0191 T is the temperature measured in K. 1 t is the initial rate of reaction in s1. A graph of log10 1 t` j against 1 T can be plotted. Experimental procedure 1. 2. 3. 4. 25 cm3 of dilute hydrochloric acid is added to a boiling tube. The boiling tube is placed in a water bath until the dilute hydrochloric acid reaches a constant temperature. This temperature is recorded. A magnesium strip of mass 0.10 g is added to the boiling tube, the mixture stirred and the time taken for the magnesium to disappear is recorded. The temperature of the water bath is changed and the experiment is repeated.UCLES 2016 9701/53/M/J/16 [Turn over<br />
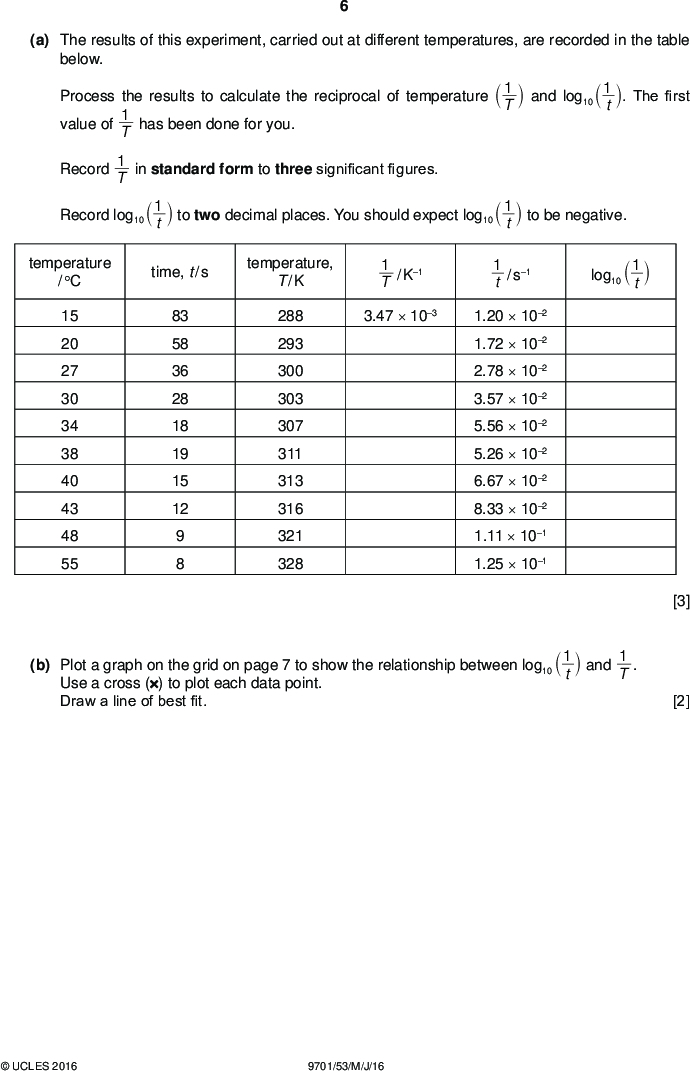
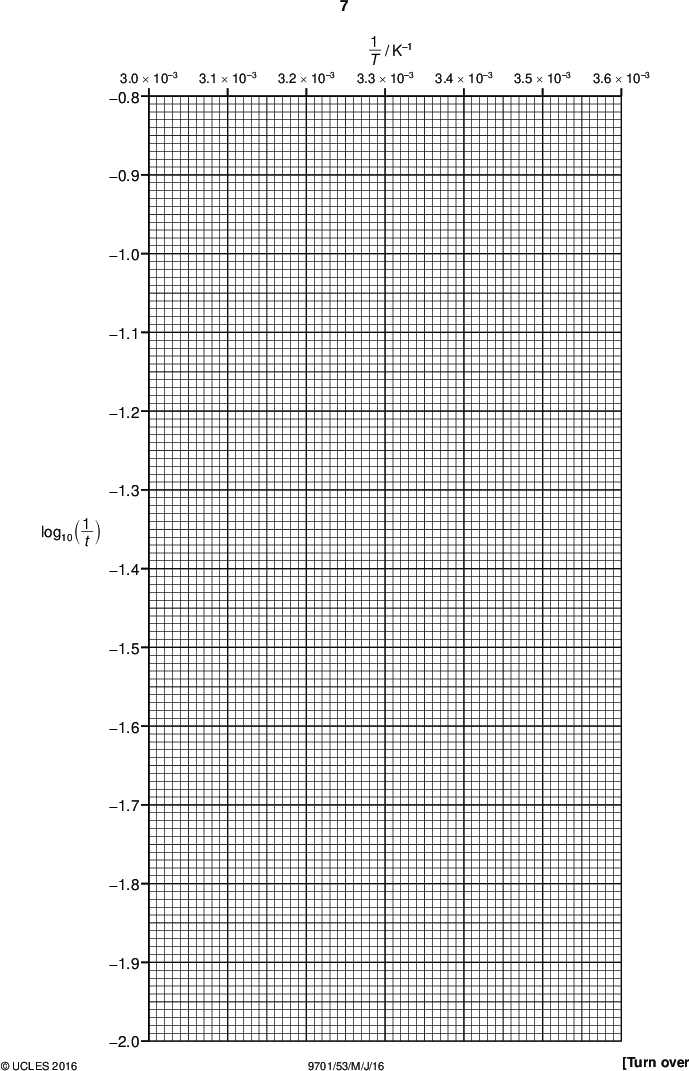
PMT (a) The results of this experiment, carried out at different temperatures, are recorded in the table below. Process the results to calculate the reciprocal of temperature 1 T` value of 1 T has been done for you. j and log10 1 t` j. The first Record 1 T in standard form to three significant figures. Record log10 1 t` j to two decimal places. You should expect log10 1 t` j to be negative. temperature / C time, t / s temperature, T / K 1 T / K1 1 t / s1 log10 1 t` j 15 20 27 30 34 38 40 43 48 55 83 58 36 28 18 19 15 12 9 8 288 293 300 303 307 311 313 316 321 328 3.47103 1.20102 1.72102 2.78102 3.57102 5.56102 5.26102 6.67102 8.33102 1.11101 1.25101 (b) Plot a graph on the grid on page 7 to show the relationship between log10 1 t` j and 1 T . Use a cross () to plot each data point. Draw a line of best fit. [3] [2]UCLES 2016 9701/53/M/J/16<br />
1 T / K1 3.3103 3.4103 3.5103 3.6103 3.0103 0.8 3.1103 3.2103 PMT 1 log10 ` j t 0.9 1.0 1.1 1.2 1.3 1.4 1.5 1.6 1.7 1.8 1.9 2.0UCLES 2016 9701/53/M/J/16 [Turn over<br />
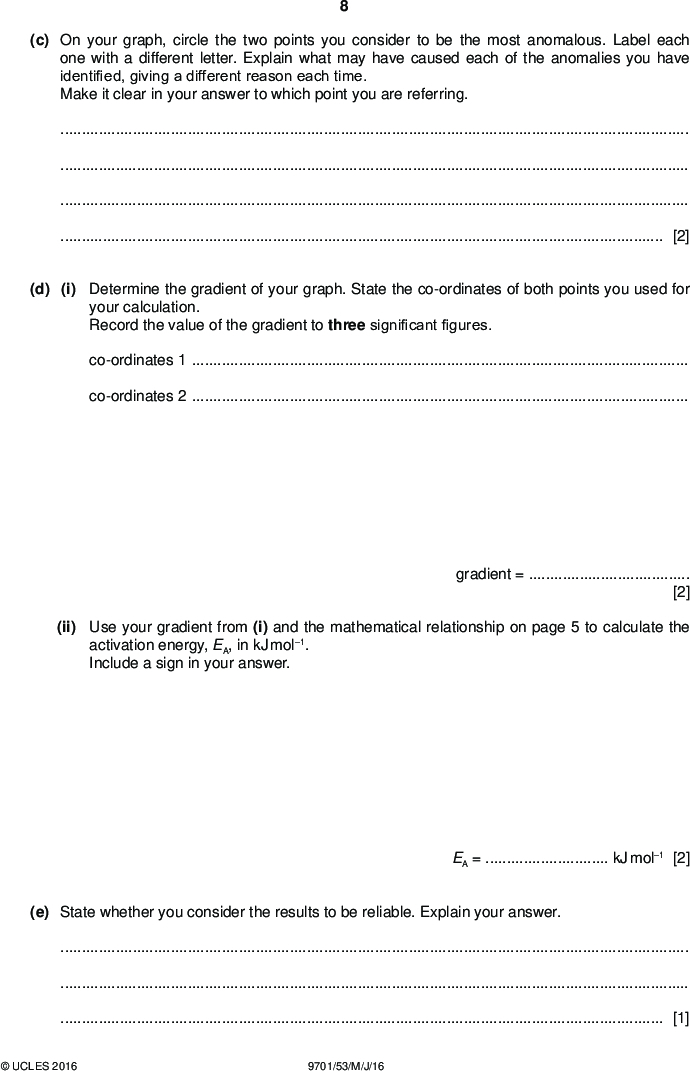
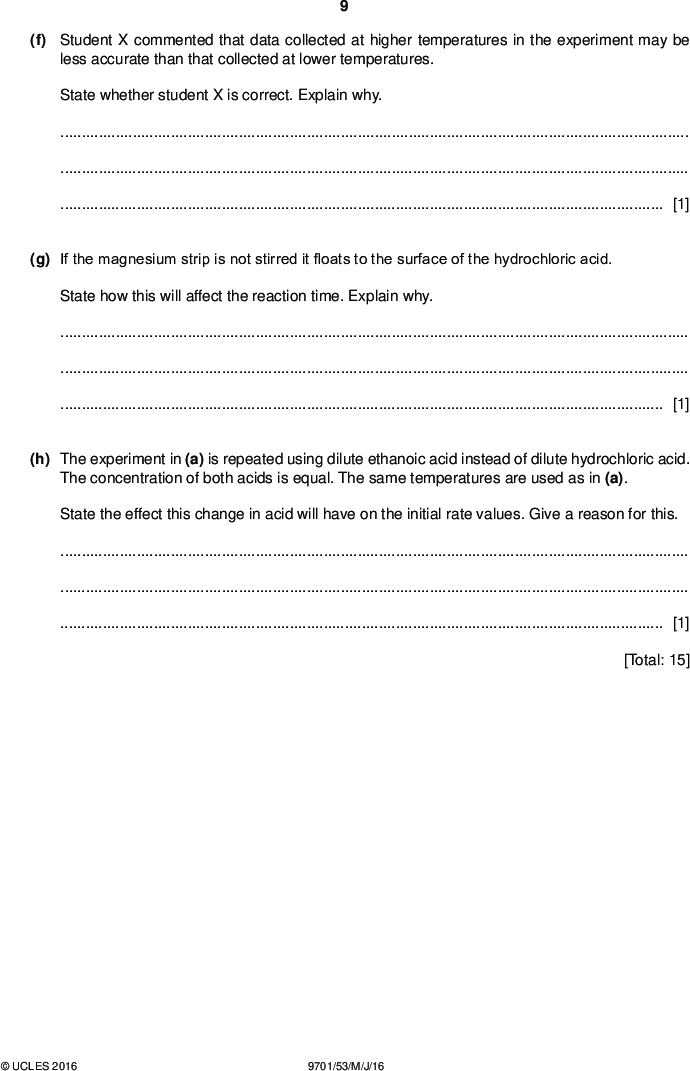
PMT (c) On your graph, circle the two points you consider to be the most anomalous. Label each one with a different letter. Explain what may have caused each of the anomalies you have identified, giving a different reason each time. Make it clear in your answer to which point you are referring.[2] (d) (i) Determine the gradient of your graph. State the co-ordinates of both points you used for your calculation. Record the value of the gradient to three significant figures. co-ordinates 1co-ordinates 2(ii) Use your gradient from (i) and the mathematical relationship on page 5 to calculate the activation energy, EA, in kJ mol1. Include a sign in your answer. gradient =[2] EA =kJ mol1 [2] (e) State whether you consider the results to be reliable. Explain your answer.[1]UCLES 2016 9701/53/M/J/16<br />
PMT (f) Student X commented that data collected at higher temperatures in the experiment may be less accurate than that collected at lower temperatures. State whether student X is correct. Explain why.[1] (g) If the magnesium strip is not stirred it floats to the surface of the hydrochloric acid. State how this will affect the reaction time. Explain why.[1] (h) The experiment in (a) is repeated using dilute ethanoic acid instead of dilute hydrochloric acid. The concentration of both acids is equal. The same temperatures are used as in (a). State the effect this change in acid will have on the initial rate values. Give a reason for this.[1] [Total: 15]UCLES 2016 9701/53/M/J/16 [Turn over<br />](https://learnah.org/wp-content/uploads/2018/08/June_2016_v3_QP_-_Paper_5_CIE_Chemistry_A-level_2-0.jpg)
![Page 4 Cambridge International AS/A LevelMay/June 2016 9701 53 Mark Scheme Syllabus Paper Expected Answer Mark Question (a) 1 / T / K1 log10 (1 / t) 3.47103 1.92 3.41103 1.76 3.33103 1.56 3.30103 1.45 3.26103 1.25 or 1.26 3.22103 1.28 3.19103 1.18 3.16103 1.08 3.12103 0.95 3.05103 0.90 Column values for 1 / T correctly calculated Column values for log10(1 / t) correctly calculated 3sf in 1 / T AND 2 dp in log10(1 / t) (b) candidates points plotted correctly from table in 2(a) line of best fit drawnCambridge International Examinations 2016 [1] [1] [1] [1] [1]<br />
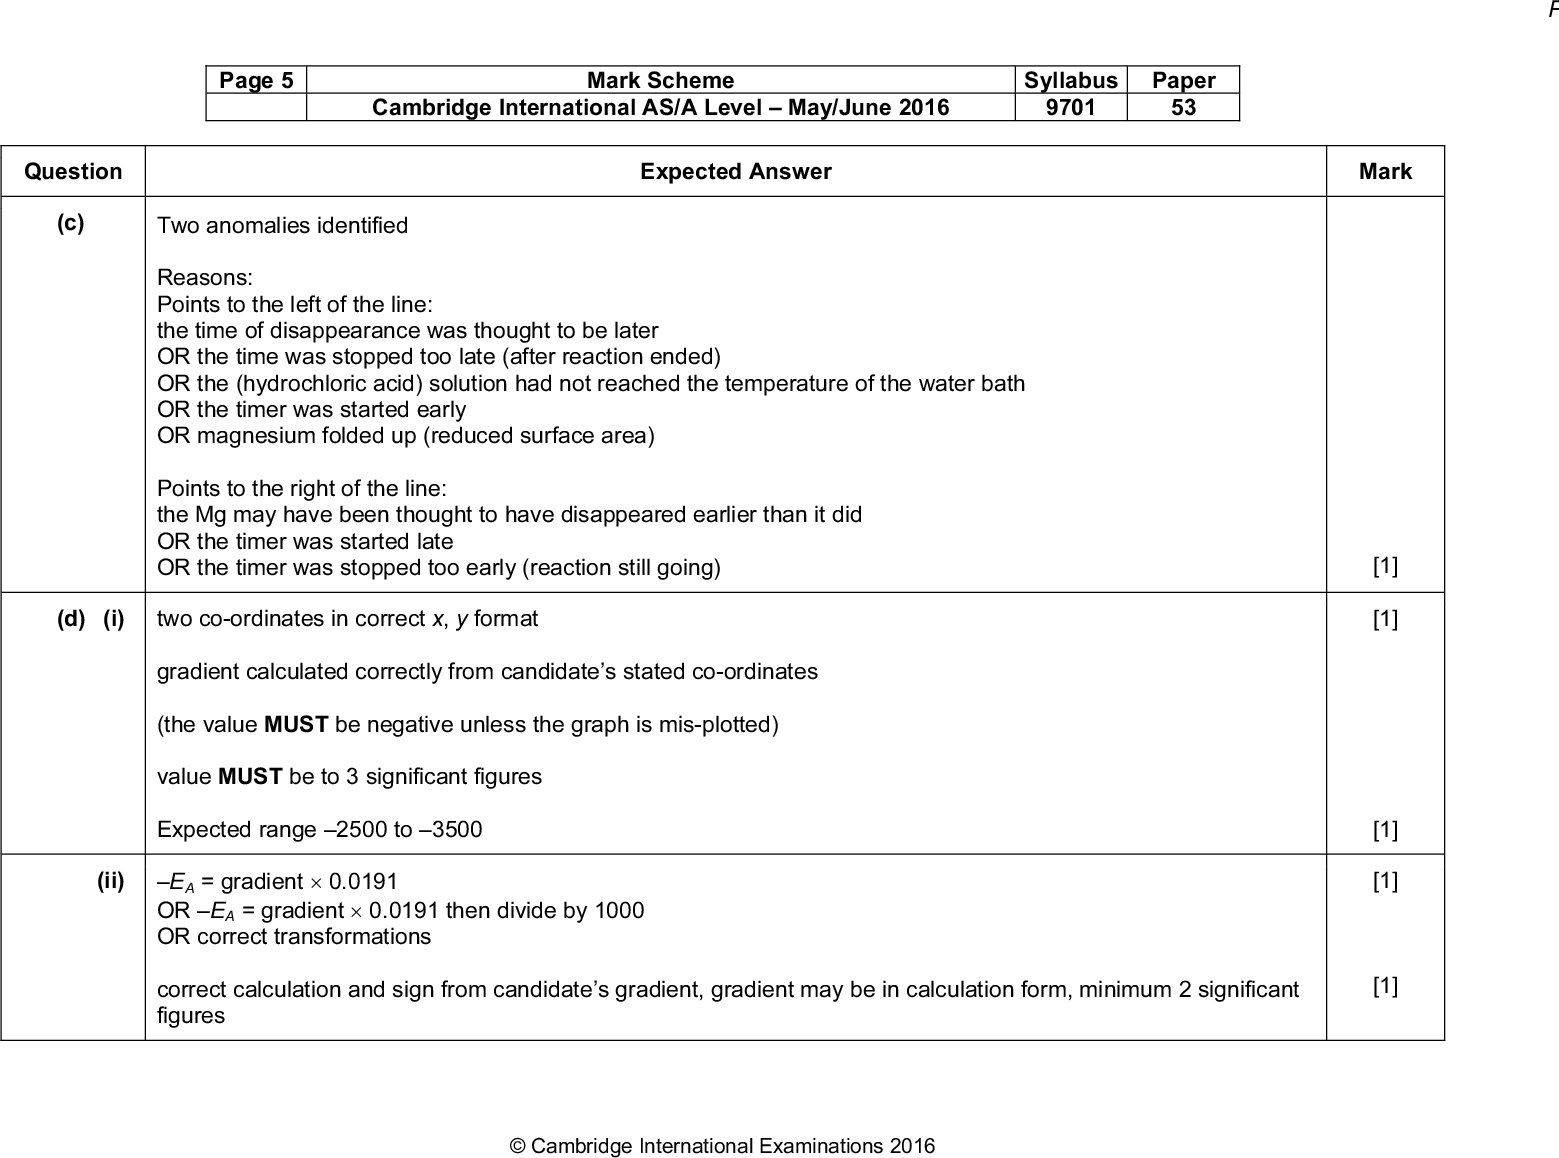
Question Page 5 Cambridge International AS/A LevelMay/June 2016 9701 53 Mark Scheme Syllabus Paper Expected Answer Mark (c) Two anomalies identified Reasons: Points to the left of the line: the time of disappearance was thought to be later OR the time was stopped too late (after reaction ended) OR the (hydrochloric acid) solution had not reached the temperature of the water bath OR the timer was started early OR magnesium folded up (reduced surface area) Points to the right of the line: the Mg may have been thought to have disappeared earlier than it did OR the timer was started late OR the timer was stopped too early (reaction still going) (d) (i) two co-ordinates in correct x, y format gradient calculated correctly from candidates stated co-ordinates (the value MUST be negative unless the graph is mis-plotted) value MUST be to 3 significant figures Expected range 2500 to 3500 (ii) EA = gradient0.0191 OR EA = gradient0.0191 then divide by 1000 OR correct transformations correct calculation and sign from candidates gradient, gradient may be in calculation form, minimum 2 significant figuresCambridge International Examinations 2016 [1] [1] [1] [1] [1]<br />
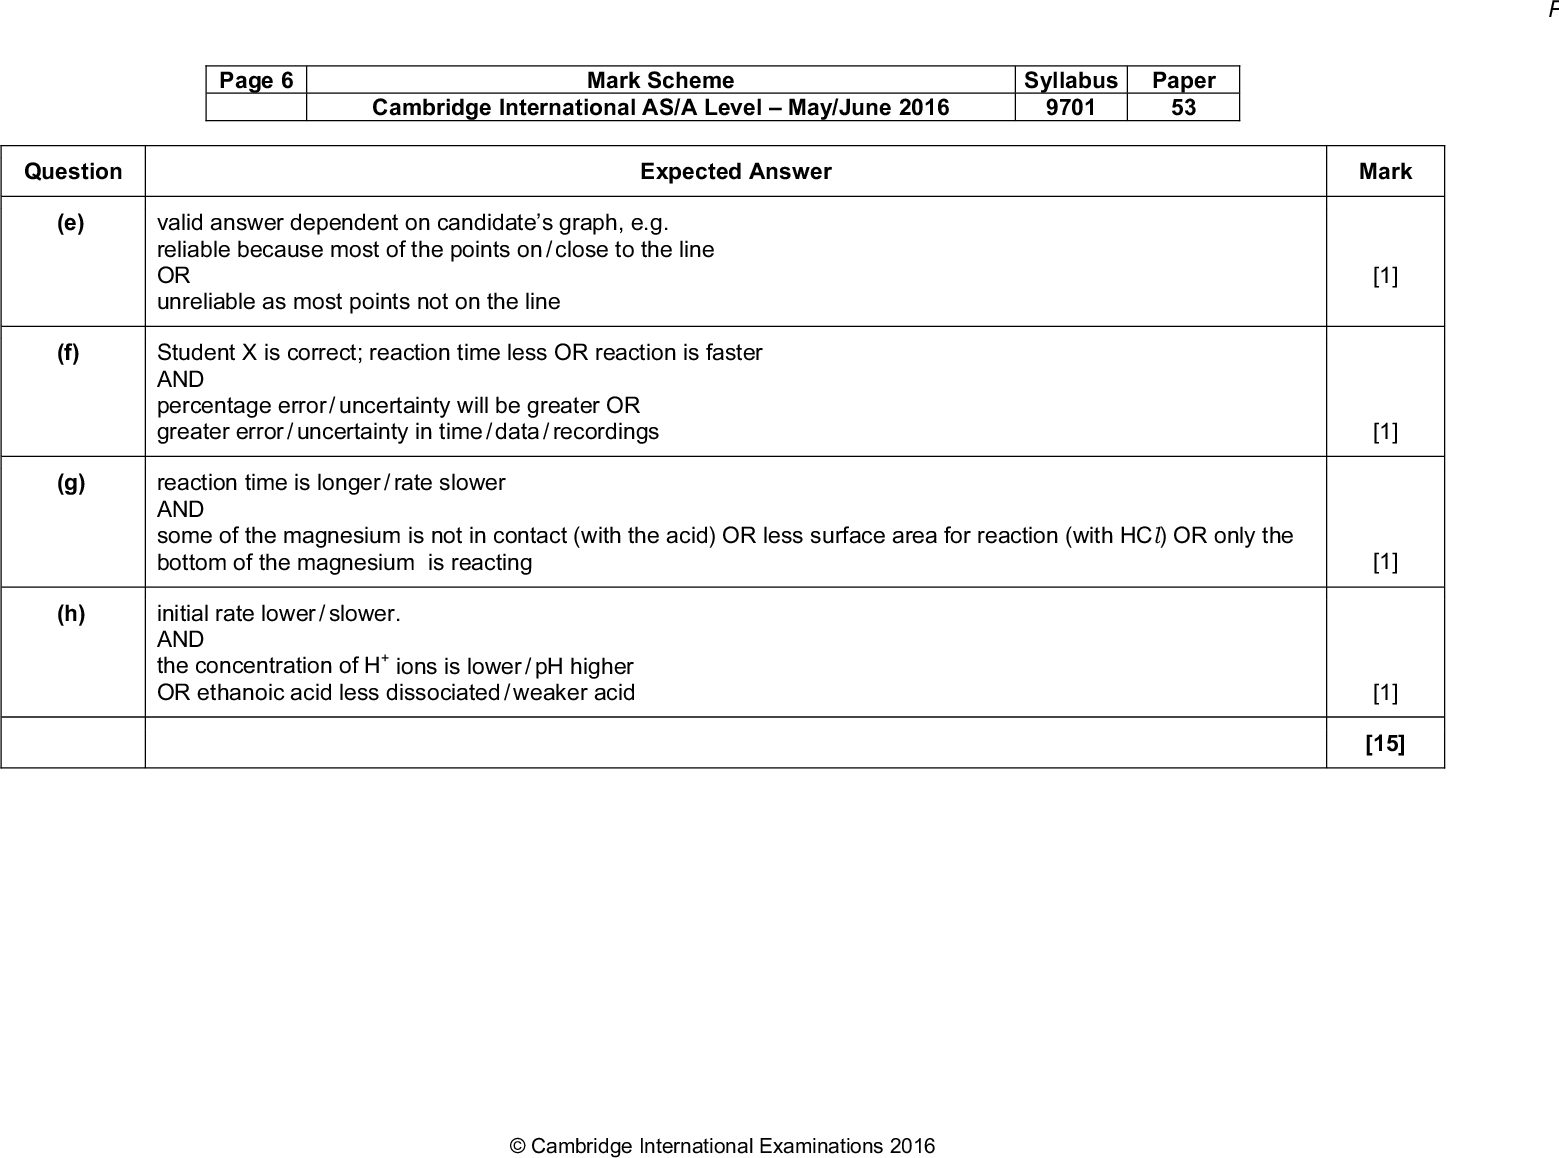
Page 6 Cambridge International AS/A LevelMay/June 2016 9701 53 Mark Scheme Syllabus Paper Question Expected Answer (e) (f) (g) (h) valid answer dependent on candidates graph, e.g. reliable because most of the points on / close to the line OR unreliable as most points not on the line Student X is correct; reaction time less OR reaction is faster AND percentage error / uncertainty will be greater OR greater error / uncertainty in time / data / recordings reaction time is longer / rate slower AND some of the magnesium is not in contact (with the acid) OR less surface area for reaction (with HCl) OR only the bottom of the magnesium is reacting initial rate lower / slower. AND the concentration of H+ ions is lower / pH higher OR ethanoic acid less dissociated / weaker acid Mark [1] [1] [1] [1] [15]Cambridge International Examinations 2016<br />](https://learnah.org/wp-content/uploads/2018/08/June_2016_v3_MS_-_Paper_5_CIE_Chemistry_A-level_2-0.jpg)