Skip to content
AQA Specimen Paper 2 Q10
Answers available below
Show answer
Question
1
2
3
4
5
6
7
8
9
10
11
12

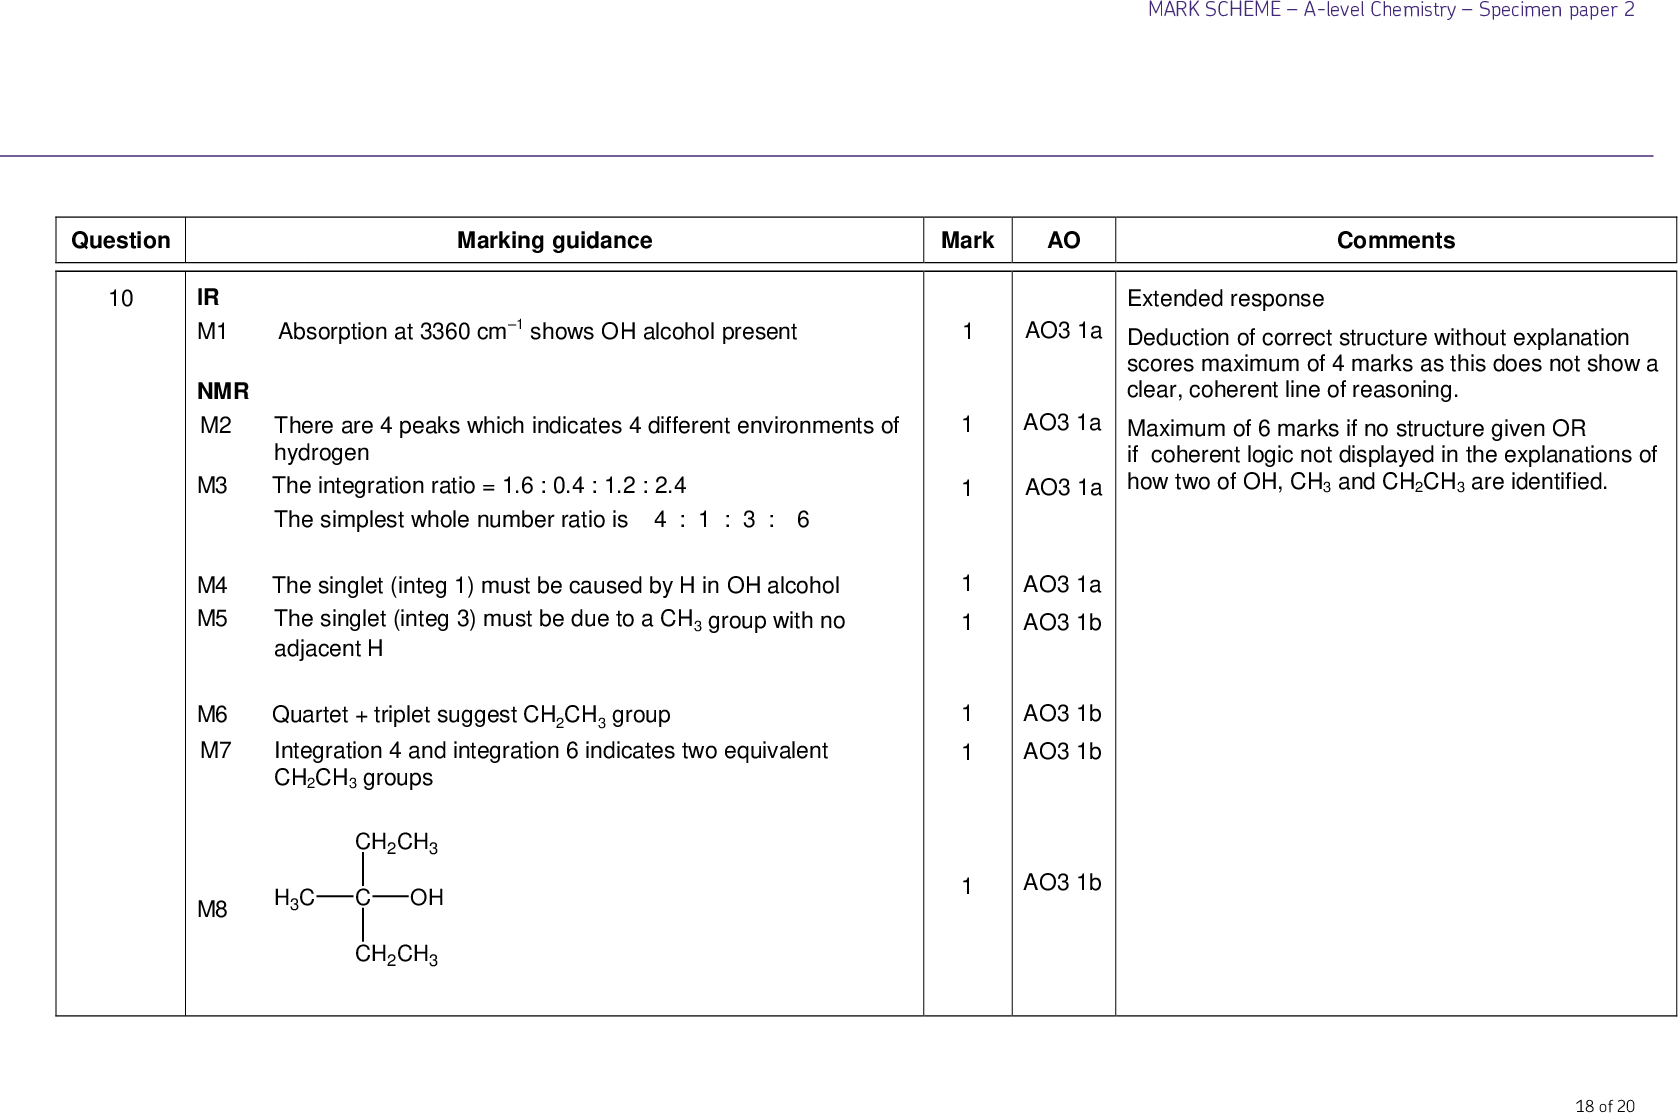
![10 26 The infrared spectrum (Figure 9) and the 1H NMR spectrum (Figure 10) of compound R with molecular formula C6H14O are shown. 100 Figure 9 Transmittance / % 50 0 4000 3000 2000 Wavenumber / cm1 1500 1000 500 Figure 10 1.2 2.4 1.6 0.4 2/ ppm Barcode Typesetter code<br />
1 0 27 The relative integration values for the NMR peaks are shown on Figure 10. Deduce the structure of compound R by analysing Figure 9 and Figure 10. Explain each stage in your deductions. Use Table A and Table B on the Data Sheet. [8 marks] Barcode Turn over for the next question Typesetter code Turn over <br />](https://learnah.org/wp-content/uploads/2018/08/Specimen_QP_-_Paper_2_AQA_Chemistry_A-Level_10-0-1.jpg)