Skip to content
AQA Jun 2017 Paper 2 Q1
Answers available below
Show answer
Question
1
2
3
4
5
6
7
8
9
10
11

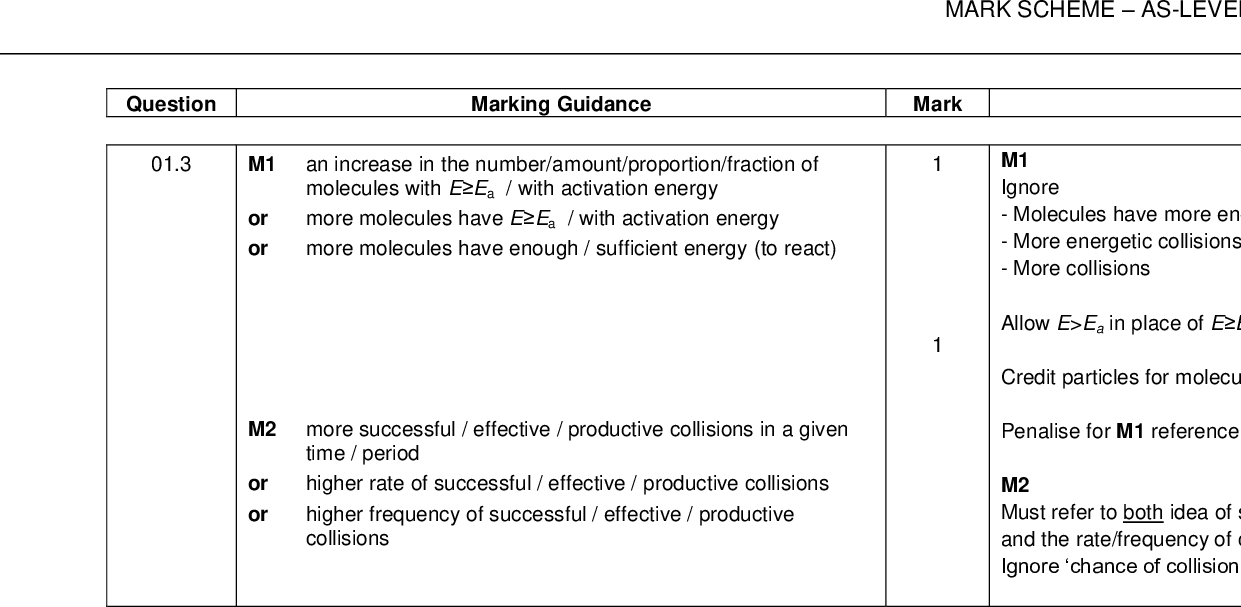
![Section A Answer all questions in this section. 0 1 Figure 1 shows the MaxwellBoltzmann distribution of molecular energies in a sample of gas at a fixed temperature. Figure 1 Label the horizontal axis in Figure 1. [1 mark] On Figure 1, sketch a distribution of molecular energies for this sample of gas at a higher temperature. [2 marks] This gas decomposes on heating. Explain why an increase in temperature increases the rate at which this gas decomposes. [2 marks] 0 1 . 1 0 1 . 2 0 1 . 3 *02* IB/M/Jun17/7404/2<br />](https://learnah.org/wp-content/uploads/2018/08/June_2017_QP_-_Paper_2_AQA_Chemistry_AS-Level_1.jpg)