
Thin layer chromatography


Chromatography Chromatography is an analytical technique that separates components in a mixture between a mobile phase and a stationary phase The mobile phase may be a liquid or a gas. The stationary phase may be a solid (as in thinlayer chromatography, TLC) or either a liquid or solid on a solid support (as in gas chromatography, GC) A solid stationary phase separates by adsorption, A liquid stationary phase separates by relative solubility If the stationary phase was polar and the moving phase was non- polar e.g. Hexane. Then non- polar compounds would pass through the column more quickly than polar compounds as they would have a greater solubility in the non-polar moving phase. (Think about intermolecular forces) Separation by column chromatography depends on the balance between solubility in the moving phase and retention in the stationary phase. 6.3.1 Chromatography and Analysis TLC Chromatography (thin-layer chromatography) A mixture can be separated by chromatography and identified from the amount they have moved. (Can be used with mixtures of amino acids) Rf value = distance moved by amino acid distance moved by the solvent Each substance has its own Rf value Measure how far each spot travels relative to the solvent front and calculate the Rf value. Compare Rf values to those for known substances. Method Take chromatography paper and draw a pencil line 1.5cm from bottom. With a capillary tube put a small drop of amino acid on pencil line Roll up paper and stand it in a large beaker. The solvent in the beaker should be below the pencil line. Allow to stand for 20 mins and mark final solvent level Spray paper with ninhydrin and put in oven Some substances won’t separate because similar compounds have similar Rf values. So some spots may contain more than one compound Method: Thin-layer chromatography a) Wearing gloves, draw a pencil line 1 cm above the bottom of a TLC plate and mark spots for each sample, equally spaced along line. b) Use a capillary tube to add a tiny drop of each solution to a different spot and allow the plate to air dry. c) Add solvent to a chamber or large beaker with a lid so that is no more than 1cm in depth d) Place the TLC plate into the chamber, making sure that the level of the solvent is below the pencil line. Replace the lid to get a tight seal. e) When the level of the solvent reaches about 1 cm from the top of the plate, remove the plate and mark the solvent level with a pencil. Allow the plate to dry in the fume cupboard. f) Place the plate under a UV lamp in order to see the spots. Draw around them lightly in pencil. g) Calculate the Rf values of the observed spots. Wear plastic gloves to prevent contamination from the hands to the plate pencil line –will not dissolve in the solvent tiny drop – too big a drop will cause different spots to merge Depth of solvent– if the solvent is too deep it will dissolve the sample spots from the plate Will get more accurate results if the solvent is allowed to rise to near the top of the plate but the Rf value can be calculated if the solvent front does not reach the top of the plate lid– to prevent evaporation of toxic solvent dry in a fume cupboard as the solvent is toxic UV lamp used if the spots are colourless and not visible
/
~
~
~
/
6.3.1 Chromatography and qualitative analysis

Types of chromatography (a) interpretation of one-way TLC chromatograms in terms of Rf values M3.1 PAG6 HSW3 Interpretation of TLC to analyse organic compounds.
Gas-liquid chromatography
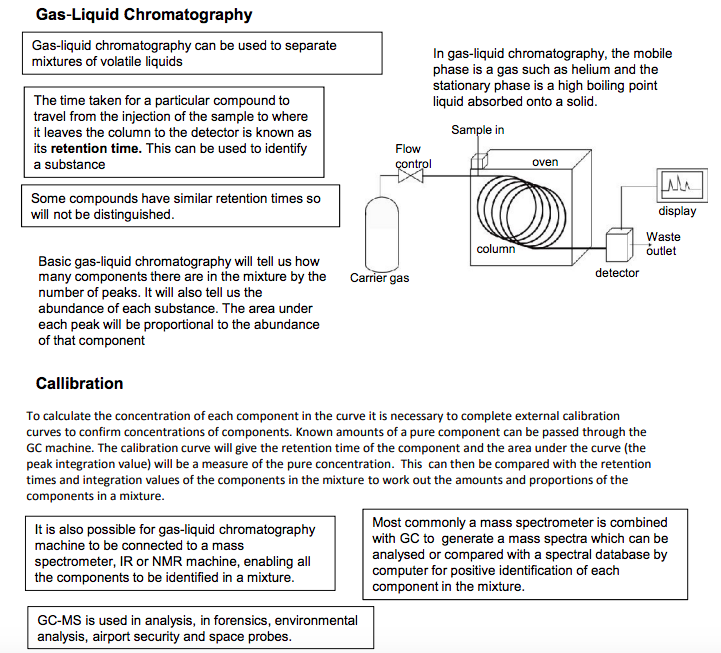
Gas-Liquid Chromatography Gas-liquid chromatography can be used to separate mixtures of volatile liquids In gas-liquid chromatography, the mobile phase is a gas such as helium and the stationary phase is a high boiling point The time taken for a particular compound to liquid absorbed onto a solid. travel from the injection of the sample to where it leaves the column to the detector is known as its retention time. This can be used to identify a substance Carrier gas detector display column oven Sample in Waste outlet Flow control Some compounds have similar retention times so will not be distinguished. Basic gas-liquid chromatography will tell us how many components there are in the mixture by the number of peaks. It will also tell us the abundance of each substance. The area under each peak will be proportional to the abundance of that component It is also possible for gas-liquid chromatography machine to be connected to a mass spectrometer, IR or NMR machine, enabling all the components to be identified in a mixture. Most commonly a mass spectrometer is combined with GC to generate a mass spectra which can be analysed or compared with a spectral database by computer for positive identification of each component in the mixture. GC-MS is used in analysis, in forensics, environmental analysis, airport security and space probes. Callibration To calculate the concentration of each component in the curve it is necessary to complete external calibration curves to confirm concentrations of components. Known amounts of a pure component can be passed through the GC machine. The calibration curve will give the retention time of the component and the area under the curve (the peak integration value) will be a measure of the pure concentration. This can then be compared with the retention times and integration values of the components in the mixture to work out the amounts and proportions of the components in a mixture.
/
~
~
~
/
6.3.1 Chromatography and qualitative analysis
(b) interpretation of gas chromatograms in terms of: (i) retention times (ii) the amounts and proportions of the components in a mixture. M3.1, M3.2 To include creation and use of external calibration curves to confirm concentrations of components. Peak integration values will be supplied. HSW3 Interpretation of GC to analyse organic compounds.
Tests for organic functional groups
Please refer to the respective topics.
(i) alkenes by reaction with bromine
(ii) haloalkanes by reaction with aqueous silver nitrate in ethanol
(iii) phenols by weak acidity but no reaction with CO3 2–
(iv) carbonyl compounds by reaction with 2,4- DNP
(v) aldehydes by reaction with Tollens’ reagent
(vi) primary and secondary alcohols and aldehydes by reaction with acidified dichromate
(vii) carboxylic acids by reaction with CO3 2–
Credits:Neil Goalby