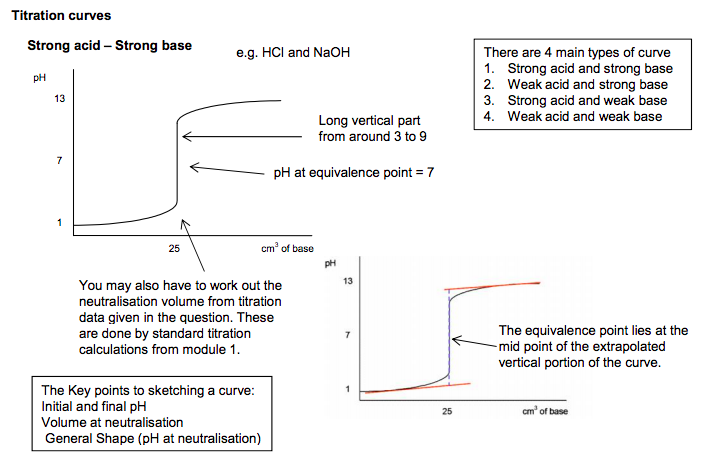
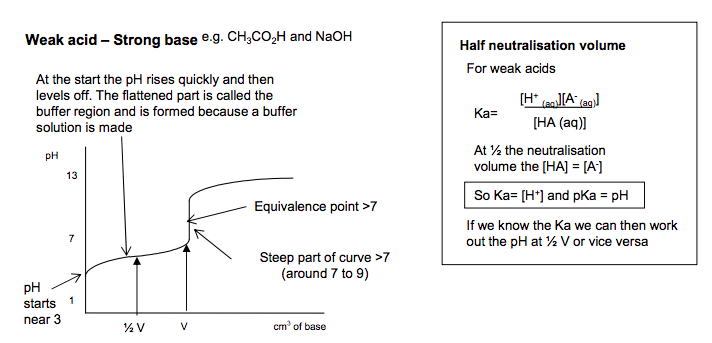
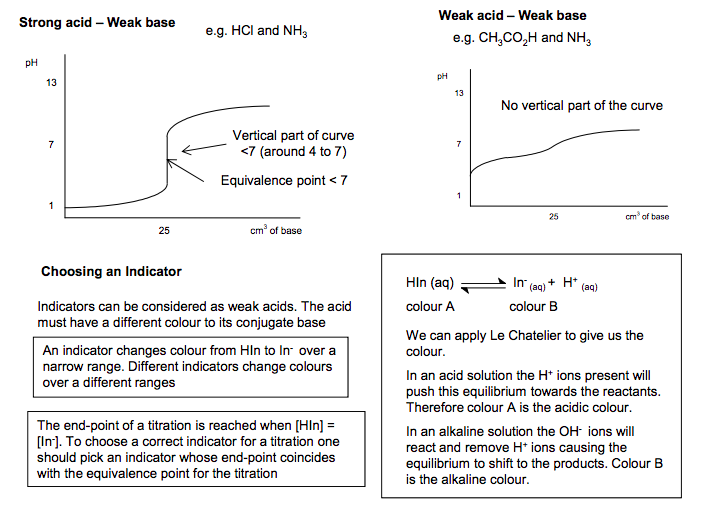
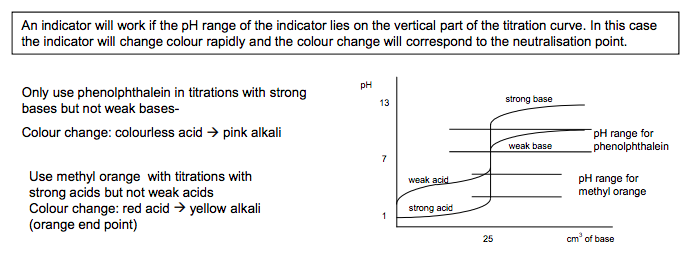
Titration curves There are 4 main types of curve 1. Strong acid and strong base 2. Weak acid and strong base 3. Strong acid and weak base 4. Weak acid and weak base The Key points to sketching a curve: Initial and final pH Volume at neutralisation General Shape (pH at neutralisation) Strong acid – Strong base pH 7 1 13 25 cm3 of base Long vertical part from around 3 to 9 pH at equivalence point = 7 You may also have to work out the neutralisation volume from titration data given in the question. These are done by standard titration calculations from module 1. The equivalence point lies at the mid point of the extrapolated vertical portion of the curve. e.g. HCl and NaOH N Goalby chemrevise.org Half neutralisation volume [H+ (aq)][A- (aq)] [HA (aq)] Ka= For weak acids At ½ the neutralisation volume the [HA] = [A-] So Ka= [H+ ] and pKa = pH If we know the Ka we can then work out the pH at ½ V or vice versa Weak acid – Strong base e.g. CH3CO2H and NaOH pH 7 1 13 V cm3 of base At the start the pH rises quickly and then levels off. The flattened part is called the buffer region and is formed because a buffer solution is made Steep part of curve >7 (around 7 to 9) Equivalence point >7 pH starts near 3 ½ V 8 pH 7 1 13 25 cm3 of base Strong acid – Weak base Equivalence point < 7 Vertical part of curve <7 (around 4 to 7) Weak acid – Weak base e.g. CH3CO2H and NH3 e.g. HCl and NH3 pH 7 1 13 25 cm3 of base No vertical part of the curve Choosing an Indicator Indicators can be considered as weak acids. The acid must have a different colour to its conjugate base HIn (aq) In- (aq) + H+ (aq) colour A colour B We can apply Le Chatelier to give us the colour. In an acid solution the H+ ions present will push this equilibrium towards the reactants. Therefore colour A is the acidic colour. In an alkaline solution the OHions will react and remove H+ ions causing the equilibrium to shift to the products. Colour B is the alkaline colour. An indicator changes colour from HIn to In- over a narrow range. Different indicators change colours over a different ranges The end-point of a titration is reached when [HIn] = [In-]. To choose a correct indicator for a titration one should pick an indicator whose end-point coincides with the equivalence point for the titration An indicator will work if the pH range of the indicator lies on the vertical part of the titration curve. In this case the indicator will change colour rapidly and the colour change will correspond to the neutralisation point. pH 7 1 13 25 cm3 of base strong base weak base strong acid weak acid pH range for phenolphthalein pH range for methyl orange Use methyl orange with titrations with strong acids but not weak acids Colour change: red acid yellow alkali (orange end point) Only use phenolphthalein in titrations with strong bases but not weak bases- Colour change: colourless acid pink alkali
/
~
~
~
/
5.1.3 Acids, bases and buffers
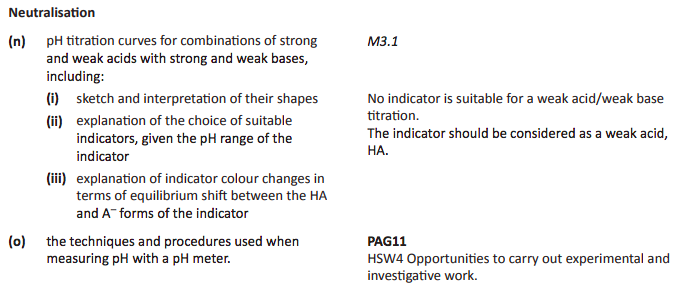

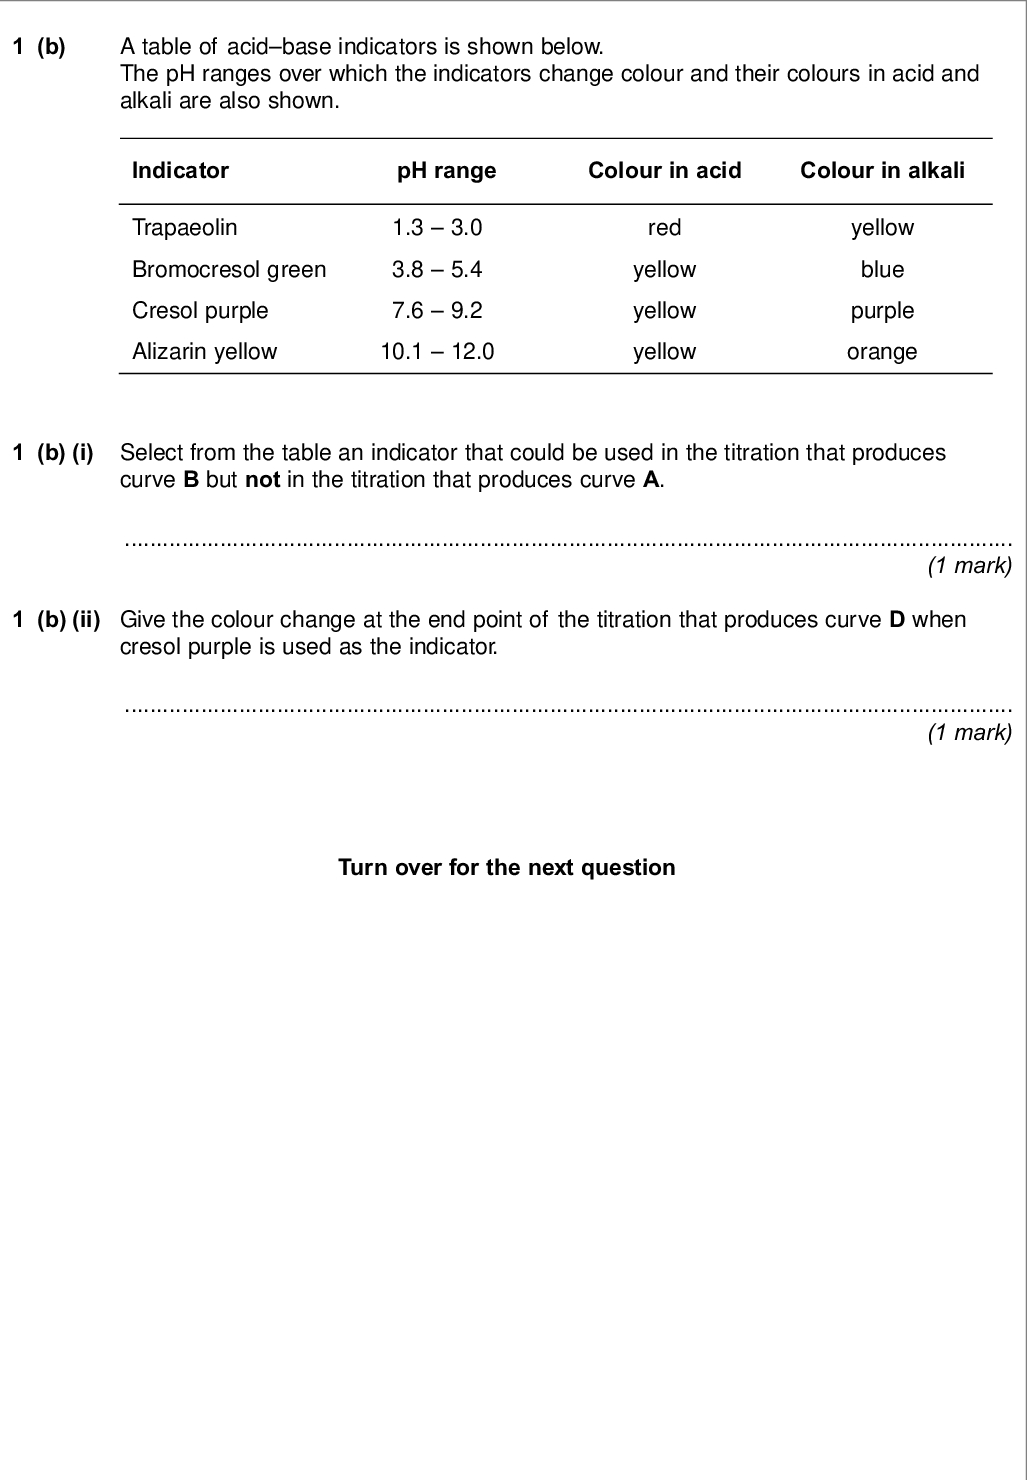
Neutralisation (n) pH titration curves for combinations of strong and weak acids with strong and weak bases, including: (i) sketch and interpretation of their shapes (ii) explanation of the choice of suitable indicators, given the pH range of the indicator (iii) explanation of indicator colour changes in terms of equilibrium shift between the HA and A– forms of the indicator M3.1 No indicator is suitable for a weak acid/weak base titration. The indicator should be considered as a weak acid, HA. (o) the techniques and procedures used when measuring pH with a pH meter. PAG11 HSW4 Opportunities to carry out experimental and investigative work.11 pH measurement • Measurement of pH Identifying unknown solutions via pH
measurements
5.1.3(o)
measurements
5.1.3(o)
 5.1.3 acids bases and buffers Page 7 - 8
 Oxford Textbook Pages : 340 - 343
 CGP Revision Guide Pages : 142 - 143