
Infrared Spectroscopy and global warming


Infrared spectroscopy Certain bonds in a molecule absorb infra-red radiation at characteristic frequencies causing the covalent bonds to vibrate Complicated spectra can be obtained than provide information about the types of bonds present in a molecule BELOW 1500 cm-1 – “Fingerprinting” Complicated and contains many signals – picking out functional group signals difficult. This part of the spectrum is unique for every compound, and so can be used as a “fingerprint”. A computer will compare the IR spectra against a database of known pure compounds to identify the compound ABOVE 1500 cm-1 – “Functional group identification” Use an IR absorption table provided in exam to deduce presence or absence of particular bonds or functional groups e.g. C=O 1640 – 1750 cm-1 O-H (acid) 2500- 3300 cm-1 H3C CH2 CH2 C O H H3C C O OH N Goalby chemrevise.org 1 2000 1500 Absorption or trough in between 1640-1750 cm-1 range indicates presence of C=O bond Always quote the wave number range from the data sheet Absorption or trough in between 2500-3300 cm-1 range indicates presence of O-H bond in an acid 4.2.4 Modern Analytical Techniques Bond Wavenumber C-O 1000-1300 C=O 1640-1750 C-H 2850 -3100 O-H Carboxylic acids 2500-3300 Very broad N-H 3200-3500 O-H Acohols, phenols 3200- 3550 broad N Goalby chemrevise.org 2 •Carbon dioxide (CO2 ), methane (CH4 ) and water vapour (H2O) are all greenhouse gases. (They trap the Earth’s radiated infra red energy in the atmosphere). •Water is the main greenhouse gas (but is natural), followed by carbon dioxide and methane. The Earth is thought to be getting warmer, and many scientists believe it is due to increasing amounts of greenhouse gases in the atmosphere. Concentrations of Carbon dioxide in the atmosphere have risen significantly in recent years due to increasing burning of fossil fuels. Carbon dioxide is a particularly effective greenhouse gas and its increase is thought to be largely responsible for global warming. The ‘Greenhouse Effect’ Infrared radiation is absorbed by C=O, O–H and C–H bonds in H2O, CO2 and CH4 . These absorptions contribute to global warming The ‘Greenhouse Effect’ of a given gas is dependent both on its atmospheric concentration and its ability to absorb infrared radiation and also its residence time. (Time it stays in atmosphere) Modern breathalysers measure ethanol in the breath by analysis using infrared spectroscopy Infrared spectroscopy can be used to monitor gases causing air pollution (e.g. CO and NO from car emissions)use spectra to identify particular functional groups limited to data presented in wavenumber form e.g. an alcohol from an absorption peak of the O–H bond, O-H absorptions tend to be broad
/
~
~
~
/
4.2.4 Analytical techniques

Infrared spectroscopy (a) infrared (IR) radiation causes covalent bonds to vibrate more and absorb energy (b) absorption of infrared radiation by atmospheric gases containing C=O, O–H and C–H bonds (e.g. H2O, CO2 and CH4), the suspected link to global warming and resulting changes to energy usage HSW9,10,11,12 Acceptance of scientific evidence explaining global warming has prompted governments towards policies to use renewable energy supplies. (c) use of an infrared spectrum of an organic compound to identify: (i) an alcohol from an absorption peak of the O–H bond (ii) an aldehyde or ketone from an absorption peak of the C=O bond (iii) a carboxylic acid from an absorption peak of the C=O bond and a broad absorption peak of the O–H bond M3.1 In examinations, infrared absorption data will be provided on the Data Sheet. Learners should be aware that most organic compounds produce a peak at approximately 3000 cm–1 due to absorption by C–H bonds. (d) interpretations and predictions of an infrared spectrum of familiar or unfamiliar substances using supplied data M3.1 Restricted to functional groups studied in this specification (see also 6.3.2 e). HSW3,5 Analysis and interpretation of spectra. (e) use of infrared spectroscopy to monitor gases causing air pollution (e.g. CO and NO from car emissions) and in modern breathalysers to measure ethanol in the breath HSW12 Use of analytical techniques to provide evidence for law courts, e.g. drink driving.
Mass spectrometry
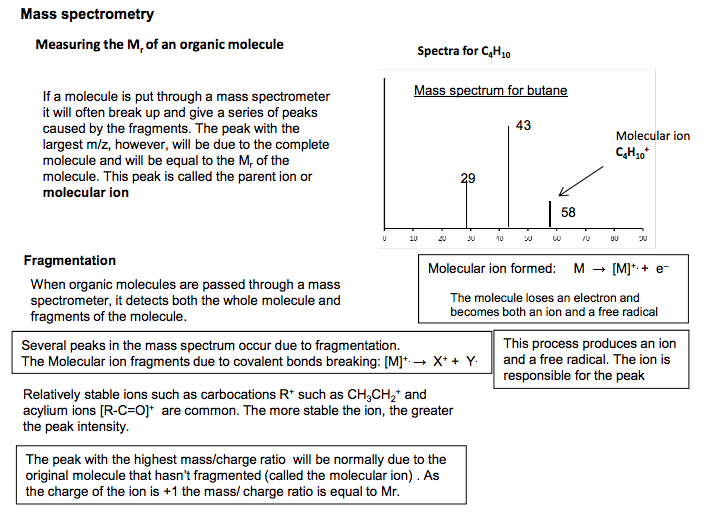
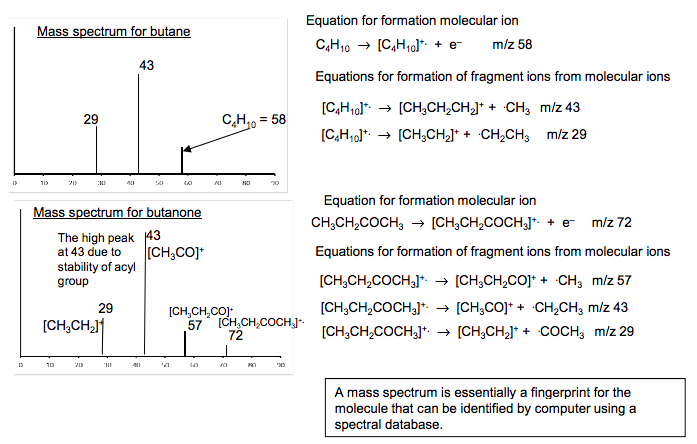
Mass spectrometry Measuring the Mr of an organic molecule If a molecule is put through a mass spectrometer it will often break up and give a series of peaks caused by the fragments. The peak with the largest m/z, however, will be due to the complete molecule and will be equal to the Mr of the molecule. This peak is called the parent ion or molecular ion Molecular ion C4H10 + Spectra for C4H10 58 Mass spectrum for butane 43 29 The peak with the highest mass/charge ratio will be normally due to the original molecule that hasn’t fragmented (called the molecular ion) . As the charge of the ion is +1 the mass/ charge ratio is equal to Mr. When organic molecules are passed through a mass spectrometer, it detects both the whole molecule and fragments of the molecule. C4H10 = 58 Mass spectrum for butane Molecular ion formed: M → [M]+. + e– The molecule loses an electron and becomes both an ion and a free radical Fragmentation Several peaks in the mass spectrum occur due to fragmentation. The Molecular ion fragments due to covalent bonds breaking: [M]+. → X+ + Y. This process produces an ion and a free radical. The ion is responsible for the peak Relatively stable ions such as carbocations R+ such as CH3CH2 + and acylium ions [R-C=O]+ are common. The more stable the ion, the greater the peak intensity. C4H10 → [C4H10] +. + e– m/z 58 [C4H10] +. → [CH3CH2CH2 ] + + .CH3 m/z 43 [C4H10] +. → [CH3CH2 ] + + .CH2CH3 m/z 29 CH3CH2COCH3 → [CH3CH2COCH3 ] +. + e– m/z 72 [CH3CH2COCH3 ] +. → [CH3CH2CO]+ + .CH3 m/z 57 [CH3CH2COCH3 ] +. → [CH3CO]+ + .CH2CH3 m/z 43 [CH3CH2COCH3 ] +. → [CH3CH2 ] + + .COCH3 m/z 29 Mass spectrum for butanone 43 29 43 29 72 57 [CH3CH2COCH3 ] +. [CH3CH2CO]+ [CH3CO]+ [CH3CH2 ] + Equation for formation molecular ion Equation for formation molecular ion Equations for formation of fragment ions from molecular ions Equations for formation of fragment ions from molecular ions The high peak at 43 due to stability of acyl group A mass spectrum is essentially a fingerprint for the molecule that can be identified by computer using a spectral database.
/
~
~
~
/
4.2.4 Analytical techniques
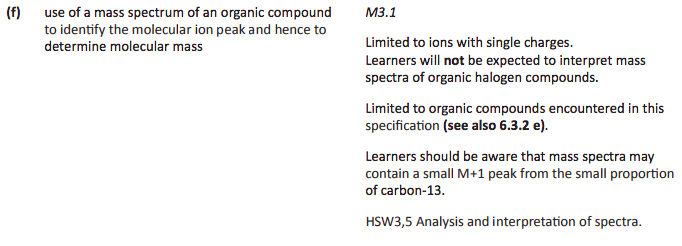
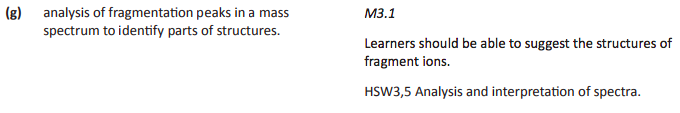
(f) use of a mass spectrum of an organic compound to identify the molecular ion peak and hence to determine molecular mass M3.1 Limited to ions with single charges. Learners will not be expected to interpret mass spectra of organic halogen compounds. Limited to organic compounds encountered in this specification (see also 6.3.2 e). Learners should be aware that mass spectra may contain a small M+1 peak from the small proportion of carbon-13. HSW3,5 Analysis and interpretation of spectra. © OCR 2016 40 A Level in Chemistry A 2 (g) analysis of fragmentation peaks in a mass spectrum to identify parts of structures. M3.1 Learners should be able to suggest the structures of fragment ions. HSW3,5 Analysis and interpretation of spectra.
Credits: Neil Goalby