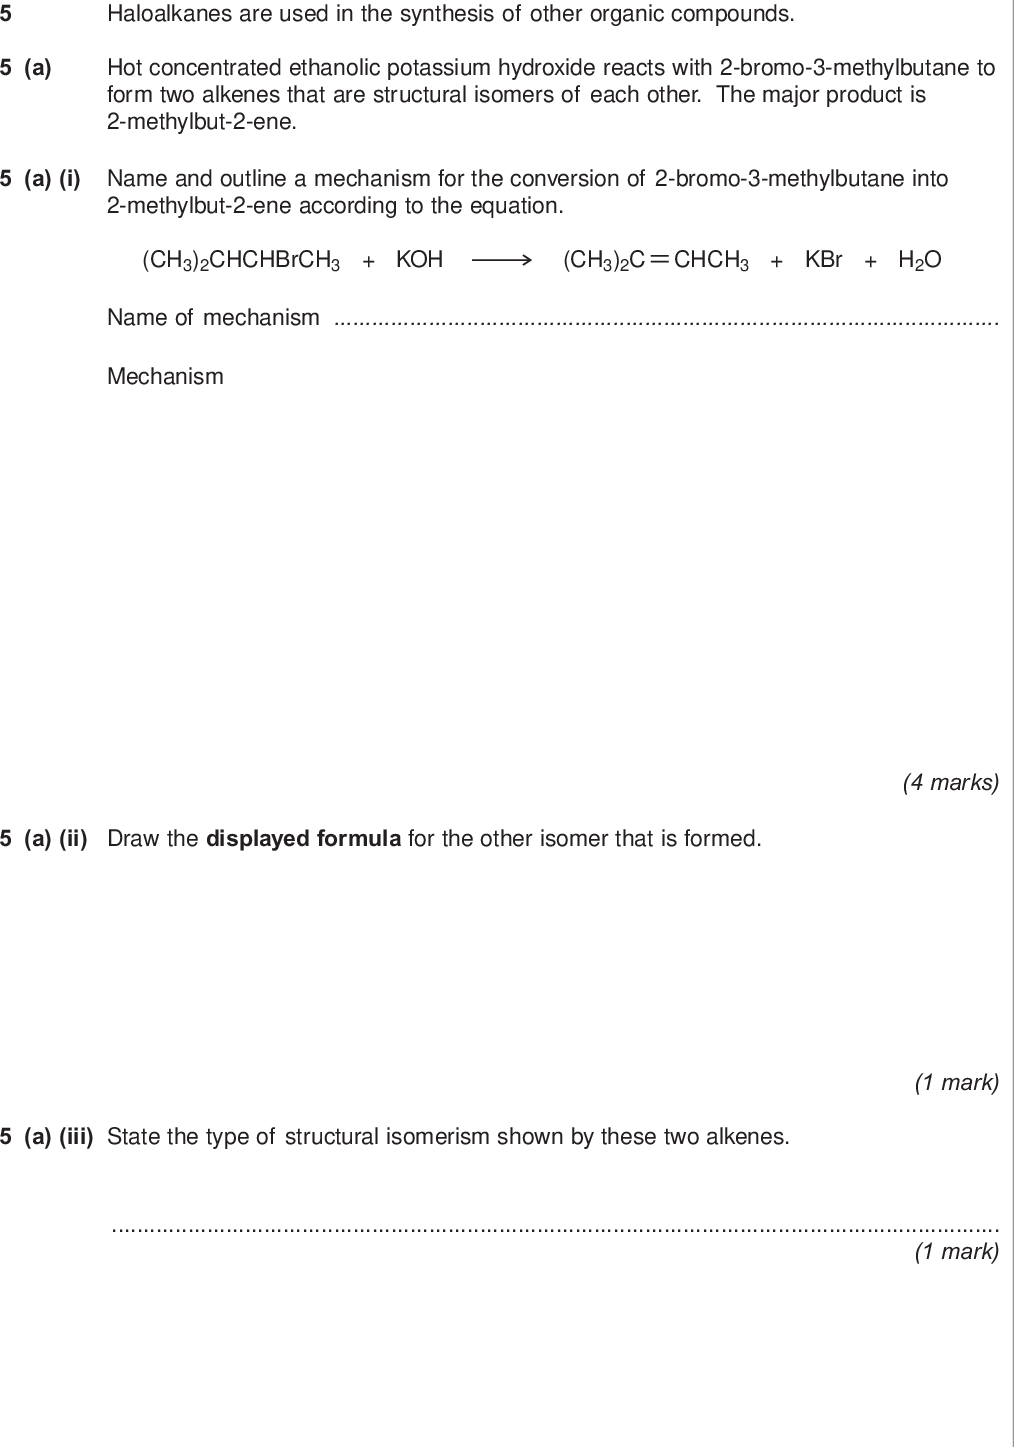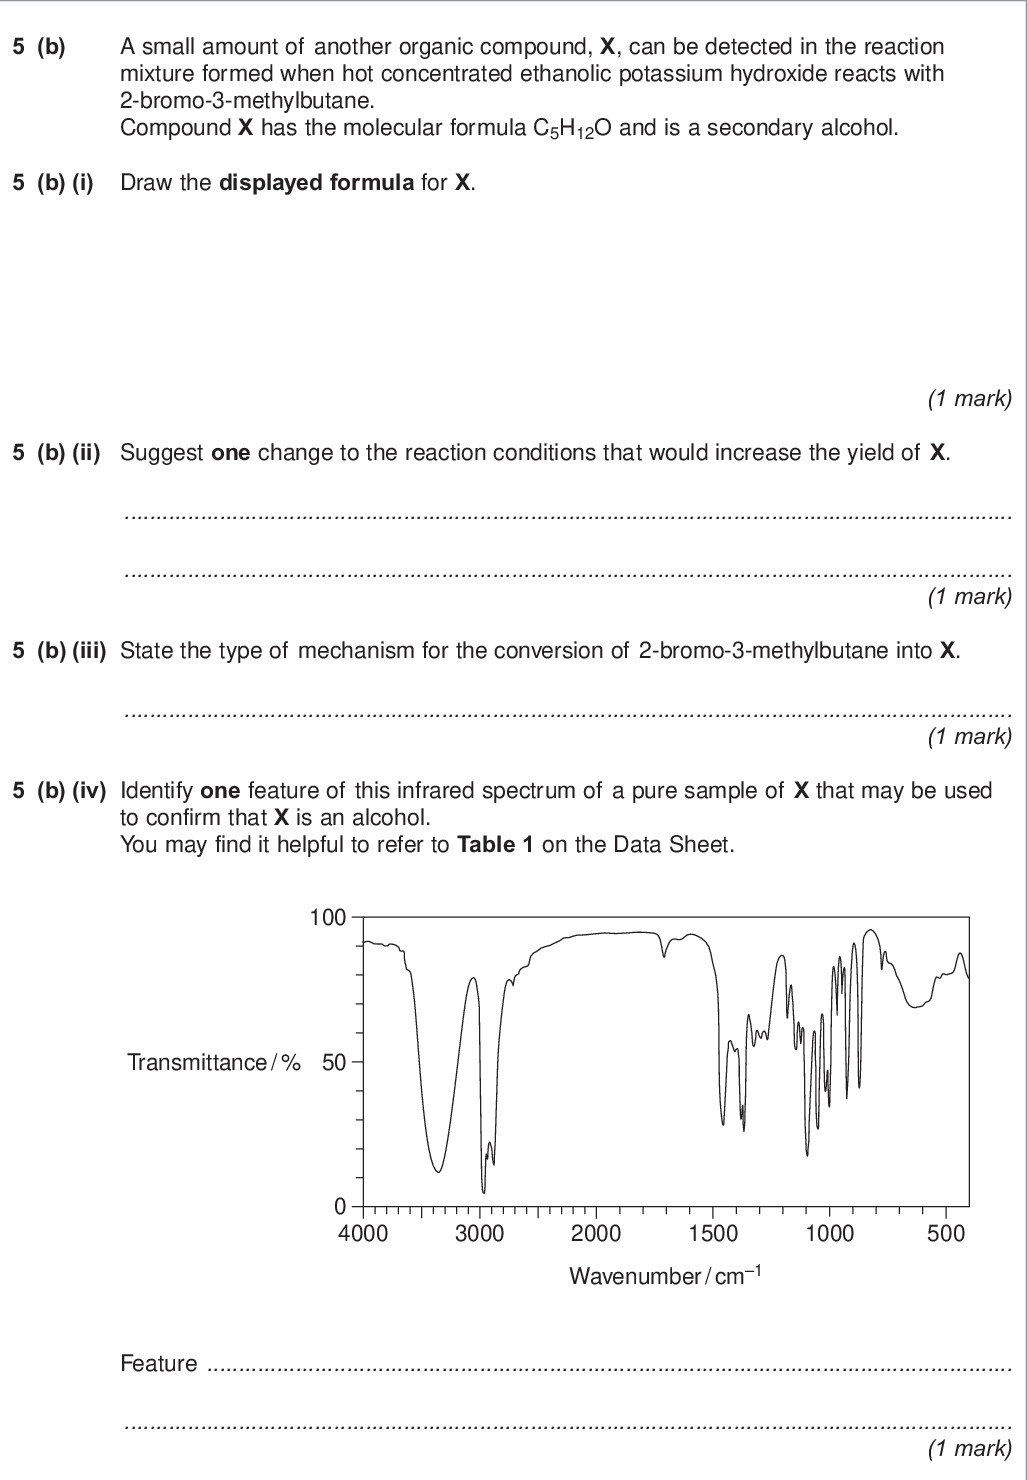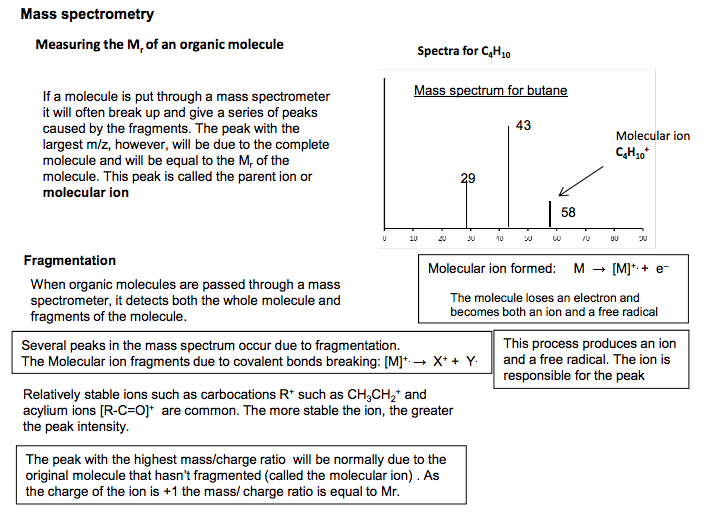
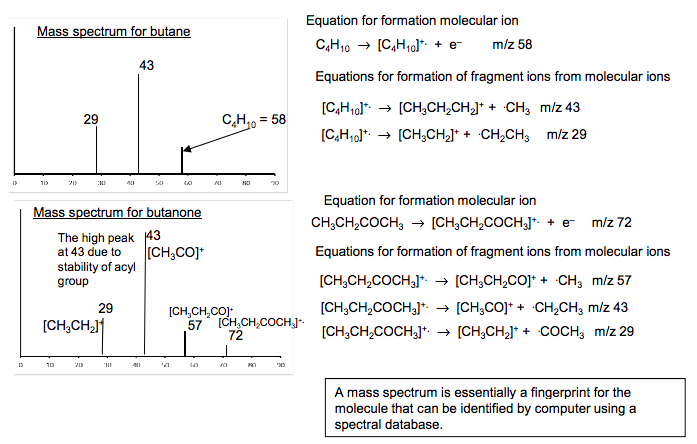
Mass spectrometry Measuring the Mr of an organic molecule If a molecule is put through a mass spectrometer it will often break up and give a series of peaks caused by the fragments. The peak with the largest m/z, however, will be due to the complete molecule and will be equal to the Mr of the molecule. This peak is called the parent ion or molecular ion Molecular ion C4H10 + Spectra for C4H10 58 Mass spectrum for butane 43 29 The peak with the highest mass/charge ratio will be normally due to the original molecule that hasn’t fragmented (called the molecular ion) . As the charge of the ion is +1 the mass/ charge ratio is equal to Mr. When organic molecules are passed through a mass spectrometer, it detects both the whole molecule and fragments of the molecule. C4H10 = 58 Mass spectrum for butane Molecular ion formed: M → [M]+. + e– The molecule loses an electron and becomes both an ion and a free radical Fragmentation Several peaks in the mass spectrum occur due to fragmentation. The Molecular ion fragments due to covalent bonds breaking: [M]+. → X+ + Y. This process produces an ion and a free radical. The ion is responsible for the peak Relatively stable ions such as carbocations R+ such as CH3CH2 + and acylium ions [R-C=O]+ are common. The more stable the ion, the greater the peak intensity. C4H10 → [C4H10] +. + e– m/z 58 [C4H10] +. → [CH3CH2CH2 ] + + .CH3 m/z 43 [C4H10] +. → [CH3CH2 ] + + .CH2CH3 m/z 29 CH3CH2COCH3 → [CH3CH2COCH3 ] +. + e– m/z 72 [CH3CH2COCH3 ] +. → [CH3CH2CO]+ + .CH3 m/z 57 [CH3CH2COCH3 ] +. → [CH3CO]+ + .CH2CH3 m/z 43 [CH3CH2COCH3 ] +. → [CH3CH2 ] + + .COCH3 m/z 29 Mass spectrum for butanone 43 29 43 29 72 57 [CH3CH2COCH3 ] +. [CH3CH2CO]+ [CH3CO]+ [CH3CH2 ] + Equation for formation molecular ion Equation for formation molecular ion Equations for formation of fragment ions from molecular ions Equations for formation of fragment ions from molecular ions The high peak at 43 due to stability of acyl group A mass spectrum is essentially a fingerprint for the molecule that can be identified by computer using a spectral database.
/
~
~
~
/
4.2.4 Analytical techniques
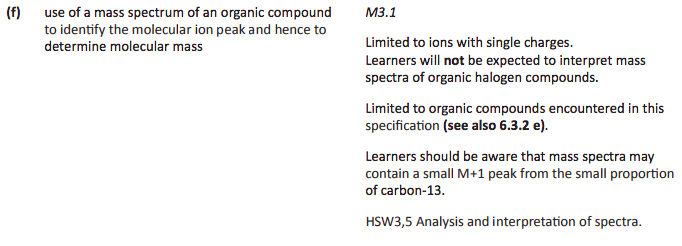
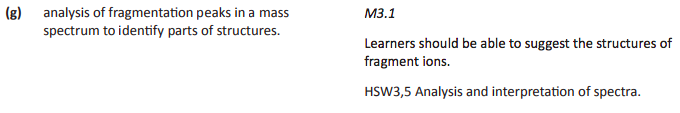
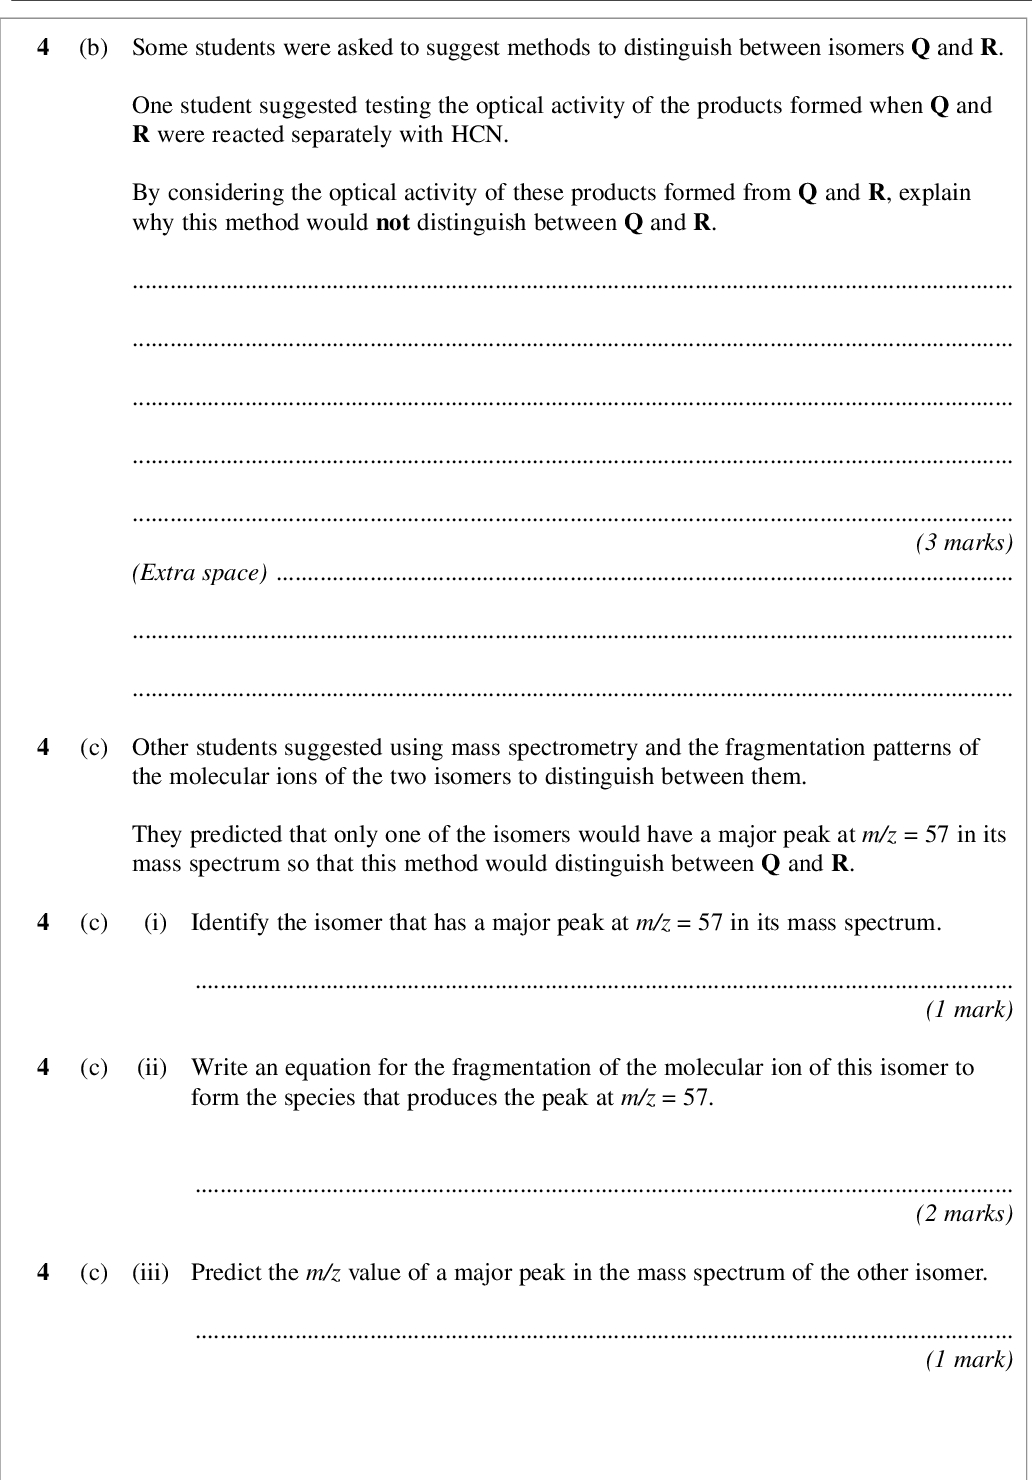
(f) use of a mass spectrum of an organic compound to identify the molecular ion peak and hence to determine molecular mass M3.1 Limited to ions with single charges. Learners will not be expected to interpret mass spectra of organic halogen compounds. Limited to organic compounds encountered in this specification (see also 6.3.2 e). Learners should be aware that mass spectra may contain a small M+1 peak from the small proportion of carbon-13. HSW3,5 Analysis and interpretation of spectra. © OCR 2016 40 A Level in Chemistry A 2 (g) analysis of fragmentation peaks in a mass spectrum to identify parts of structures. M3.1 Learners should be able to suggest the structures of fragment ions. HSW3,5 Analysis and interpretation of spectra.
 4.2.4 analytical techniques Page 3
 Oxford Textbook Pages : 252 - 255
 CGP Revision Guide Pages : 108 - 109